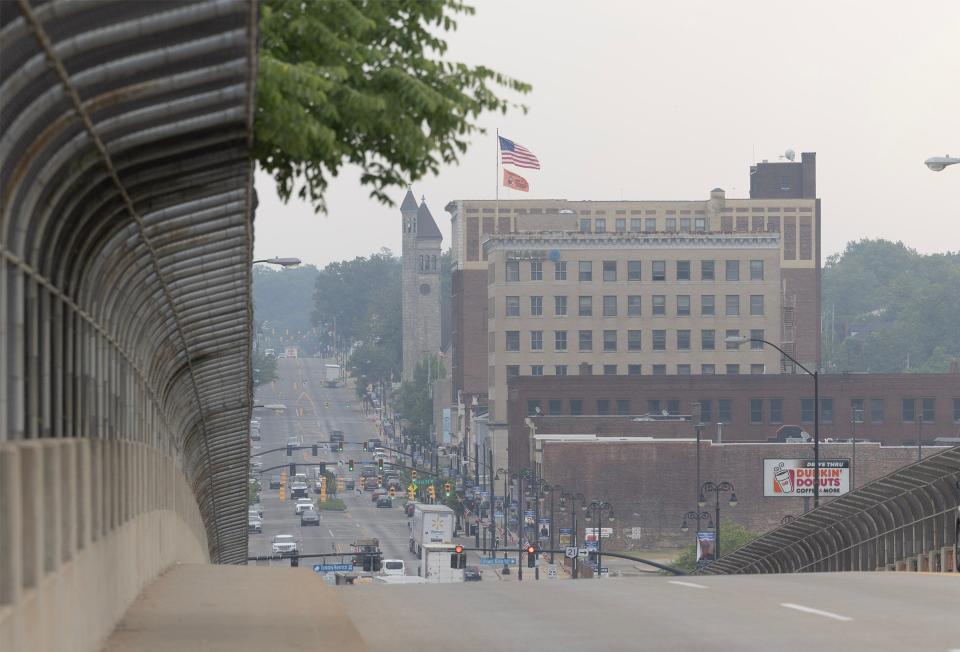
Stark County gets 1 failing, 1 passing grade from American Lung Association on air quality
Stark County's air quality has improved over the past decade but there's still room for improvement, according to the American Lung Association.
The advocacy agency released its 2024 State of the Air report last week based on U.S. Environmental Protection Agency data from 2020 to 2022. It ranked cities and counties based on ozone, short-term particle pollution and annual particle pollution.
California cities topped all three most-polluted lists but the greater Cincinnati area ranked among the top 25 cities in the nation with the highest annual particle pollution ― tying for 22nd place with the Chicago metropolitan area. Cincinnati’s ranking improved from last year, when its particle pollution was 18th worst in the nation.
Particle pollution occurs when tiny solid particles and liquid droplets from factories, power plants, and vehicles build up in the air. These particles get trapped in your lungs when you inhale them, leading to asthma attacks, heart attacks, and for those with heart or lung conditions, premature death.
How Stark County faired in ozone pollution, daily particle pollution
Stark County was in the top 10 for ozone pollution with a "D" grade and received a "B" grade for daily particle pollution. It also was among the four counties in Ohio where the annual amount of fine particulate matter surpassed the new EPA standard.
However, out of the state's 88 counties, only 22 report particle pollution and 34 report ozone data. The American Lung Association report also applied the new EPA standard, which doesn't take effect until May.
The new air quality standard will allow up to 9 micrograms per cubic meter of fine particulate pollution a year. Previously, all counties in Ohio met the federal limit of 12 micrograms per cubic meter of air.
Stark County had an annual average of 9.2 micrograms per cubic meter of air ― lower than the other "failing" counties of Cuyahoga, Montgomery and Hamilton. Hamilton County had the worst with 10.5 micrograms per cubic meter of air.
Terri Dzienis, who leads the Air Pollution Control Division of Canton City Public Health, said it was "a little disappointing" that the report already applied the new standard. The state has time to craft a plan to address any areas not meeting the new standard.
"The EPA will determine which areas are not meeting the standard based on data through 2023, and there's a lot of corrections to the data that need to happen before they do that," Dzienis said. "So we don't know how we're going to shake out at the end because we're just barely above it at the 9.2."
More: New study ranks Columbus most polluted city in US. But is it really? Here's what to know
What causes air pollution
National, regional or local industry, transportation and even pollen can contribute to pollution levels. Linda Morckel, monitoring and inspections supervisor for the Air Pollution Control Division, said some air monitors are near U.S. Route 30, where vehicle brake dust and road salt are more likely.
"We do want clean air," she said. "It's just as they lower the standards, it gets more difficult to stay within those standards."
Dzienis noted that the American Lung Association's methodology was more strict than EPA standards. She would rate the county with an "A" for ozone and fine particulate matter pollution (PM2.5).
The State of the Air uses weighted averages to "allow comparisons to be drawn based on severity of air pollution." The EPA determines ozone compliance based on the fourth-highest daily ozone reading each year averaged over three years and allows 2% of the days to exceed 35 micrograms per cubic meter for particulate pollution.
"That could be as many as 21 unhealthy days in three years," the methodology description states. "The grading used in this report is roughly equivalent to allowing only about one percent of the days to be those on which PM2.5 concentrations were over 35 µg/m3 (called a '99th percentile form')."
Overall air quality has improved as EPA standards have become more strict. According to the State of the Air, there was an average of 46.5 high ozone days a year between 1997 and 1999 in Stark County. That average was 2.3 a year from 2020 to 2022.
Similarly, the report shows the county's high particle pollution days averaged 6.7 between 2000 and 2002 and now is an average of 0.7 days. The annual average concentration of particle pollution peaked at 17.9 micrograms per cubic meter of air from 2000 to 2002.
"It's definitely due to the regulations," Dzienis said. "The Clean Air Act came out, states are implementing state regulations that control sources, and then the EPA continues bringing the standards down, so then there's new regulations that come out. So it's just a continuing cycle that happens."
Reach Kelly at 330-580-8323 or kelly.byer@cantonrep.com.
Cincinnati Enquirer reporter Elizabeth B. Kim contributed to this report.
This article originally appeared on Cincinnati Enquirer: Canton-area air quality gets mixed review from advocacy agency

