40 Years After ‘A Nation At Risk,’ Fixing Our Classrooms Through School Funding

The 74 is partnering with Stanford University’s Hoover Institution to commemorate the 40th anniversary of the ‘A Nation At Risk’ report. Hoover’s A Nation At Risk +40 research initiative spotlights insights and analysis from experts, educators and policymakers as to what evidence shows about the broader impact of 40 years of education reform and how America’s school system has (and hasn’t) changed since the groundbreaking 1983 report. Below is the project’s chapter on school finance and education funding priorities. (See our full series)
Strangely, the subject of revenues and expenditures is never addressed in A Nation at Risk (ANAR). That omission makes the cascade of calls to increase funding for schools, often justified by reference to the message of urgency in ANAR while disregarding use of funds, ironic. By ignoring the role of funding and budgeting, the recommendations from the US National Commission on Excellence in Education are untethered from any grounding in choices and trade-offs that all public policy required. On the other side, the calls for funding that are divorced from ideas of how the funds are to be used are equally problematic.
Spending on schools is frequently used as a summary statistic of the quality of schools. And in discussions of how to make schools better and more equitable, the first order of business is frequently the necessity of increasing our investment in schools—in other words, our spending on schools. Unfortunately, history has not been very supportive of this strategy.
Help fund stories like this. Donate now!
A conventional perspective is that legislatures and school districts should decide how much to spend based on the trade-off between the expected benefits of school spending and the taxes required for any given revenue. Once the revenue is determined, school districts would make budget allocations in order to produce the best student outcomes.
However, this picture is complicated in the case of schools, since states—which have primary responsibility for schools—are concerned not only with overall student outcomes but also with the equity of public provision. Two factors enter into the equity discussions. First, education is not entirely a function of schools but has components of families and circumstances that enter into student outcomes. Thus, children from more educationally disadvantaged households, English language learners, and children with various handicaps need more from the schools if they are to pull even with students not facing such difficulties. Second, because local funding is heavily reliant on local property taxes, the size of the district tax base will directly influence the ability of a school district to raise revenues. Students who happen to reside in districts where the value of residential property and the presence of commercial and industrial properties are high have an advantage in raising revenues for their schools.
The legislature in each state is charged with making political decisions about both the level of spending and how statewide education and funding differences are addressed. How to reach decisions that weigh the underlying trade-offs is vigorously debated, and every state has its own solution to this.
Legislatures are not the only actors in these discussions. Various parties who have not liked the legislative outcomes have gone to the courts to try to change the legislative decisions. Starting in California in 1968, courts in all but two states (Hawaii and Utah) have had litigation about school funding. The early cases in the 1970s and 1980s focused on equity issues largely related to differences in property tax bases and spending differentials across school districts, but the cases evolved throughout subsequent decades to focus more on the overall adequacy of funding to meet educational objectives.
The largest difficulty with the pattern and outcomes of revenue decisions is, however, the lack of a clear relationship between added spending and student outcomes. In simplest terms, the division of decisions between how much to spend and how to spend it has historically led to highly variable and quite disappointing results in terms of student outcomes. Specifically, it appears that how funds are spent is crucial—and generally more important than how much is spent. This does not say that more resources are never important for student outcomes. Nor does it say that more resources cannot be important for improved student outcomes. It does say that divorcing decisions on “how much” from “how” has not been successful within the current structure of school decision-making.
This chapter documents these overall conclusions. It then discusses alternative perspectives on funding for schools.
A short history of funding
In order to frame the school finance discussion, it is helpful to describe briefly the nature of financing of schools in the United States. The overall picture of enrollments, structure of the schools, and funding shows significant changes over time. Further, the aggregate picture hides significant variation across the states. The variety provides an important backdrop both for the analysis of school finance issues and for decision-making in the schools.
An overview of U.S. schooling
Public school enrollment in the United States, while rising during the 1990s, reached fifty million students in 2013 and stabilized there until the COVID-19 pandemic hit in 2020. The full impact of the pandemic is not yet known, but public school enrollment fell by 3 percent from fall 2020 to fall 2021 and remained at the lower level through fall 2022.
These students are spread very unevenly across states and, within states, across separate local school districts. At the state level, Vermont had a total of 82,000 students while California had six million. The prime operating level is the school district, of which there were 13,452 in 2019, down from 117,408 in 1940. Moreover, the states are broken up into widely varying numbers of local districts. While Hawaii and the District of Columbia each have only one school district, five states had more than one thousand districts.
But even these aggregate variations understate the degree of heterogeneity in the schools, because the growing importance of school choice leads to even more decentralized operation of education. The public school district is the prime operating unit, but it does not cover the full provision of education services. Charter schools were first established in Minnesota in 1991, and the model spread across the country. Charter schools are public schools that operate with varying degrees of autonomy, depending on the state. Typically, they are free to operate outside of many of the education regulations in a state, and importantly, they can set their own requirements for teacher preparation, salary schedules, and personnel rules independent of local teachers’ unions. They receive public funding, and they are almost always required to take all applying students or to randomize admissions if more students apply than they can accommodate. They are also required to participate in the state student assessment systems.
Students can also attend private schools or be homeschooled. While this is changing, private schools almost always receive no direct public funding, as is the case for homeschooling. These parts of the system are generally very unregulated, and they can set their own curricula, standards, and hiring rules. They generally do not participate in state student assessment systems, and little is known about their performance except as indicated by parental choices.
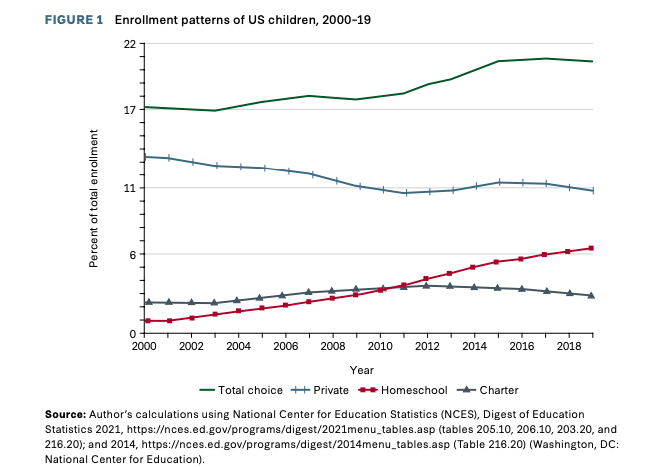
Figure 1 shows the substantial changes in the structure of US schools in the twenty-first century in terms of parental choices that interact with school finance. There has been a steady rise in charter school attendance with relatively stable homeschool attendance and some decline in private schooling. The private school attendance is one-quarter nonsectarian and three-quarters religious based, with the religious component evenly split between Catholic and other denominations.
Note, however, that these data are pre-pandemic. With the pandemic, traditional public school attendance fell, while the other choice options increased. Within the public school sector there was also a shift from the traditional public schools to charter schools. The longrun distribution of students remains unclear at this time.
Revenues for U.S. education
The structure of the education sector and the attendance patterns that were highlighted relate directly to school finances. Because private schools and homeschooling are not publicly supported (to any significant degree), any increased attendance in these sectors relieves state and local governments of resource demands.
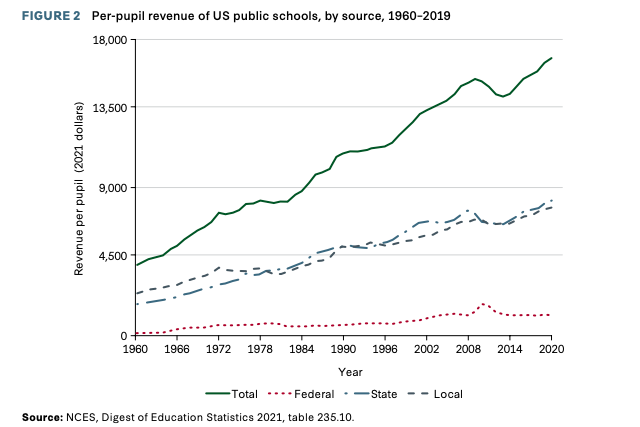
Figure 2 traces revenues for the public schools from 1960 to 2019. The bulk of funding comes from state and local revenues, which each correspond to roughly 45 percent of per-pupil funding. The federal share, which began rising in the 1960s as the federal government assumed a larger role in financing schools for disadvantaged students and subsequently for special education students, rose around the 2008 recession and then returned to its historic levels. While not shown, the federal government also contributed large additional amounts of temporary funds with the onset of the pandemic in 2020.
The steady increase in per-pupil funding over the entire period puts public school revenues per student in 2019 at more than four times that in 1960 in real terms. In fact, except for the dip in school revenues after the end of federal support for the 2008 recession, real per-pupil spending (i.e., adjusted for inflation) has risen continuously for more than one hundred years.
State revenues come from a variety of sources that differ across the fiscal structures of the different states. At the same time, with few exceptions, property taxes are the dominant source of local revenues.
Public school spending incorporates both traditional public schools and charter schools. For a variety of political and institutional reasons, charter school spending is systematically below that for traditional public schools, although there is debate about the exact magnitude of differences.
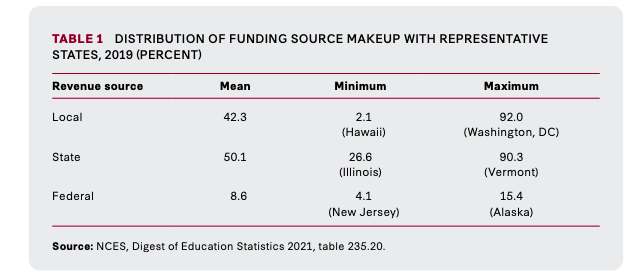
The aggregate revenue data hides the wide variation that is seen at the state level. States differ significantly in how revenues are raised and in the level of spending. Table 1 shows the extent of compositional differences in school funding. Typically, most of the revenue is derived from state and local sources with the federal government contributing a smaller portion, but the federal share across states differs from 4 percent to 15 percent of funding because the federal revenues are driven largely by poverty rates and special education classifications that differ across states. States like Hawaii, with its one district, and Vermont provide almost all funding at the state level, while funding for schools in Washington, DC, is provided almost entirely at the local level. For Alaska schools, 15 percent of the funding comes from the federal government, the highest percentage of all states.
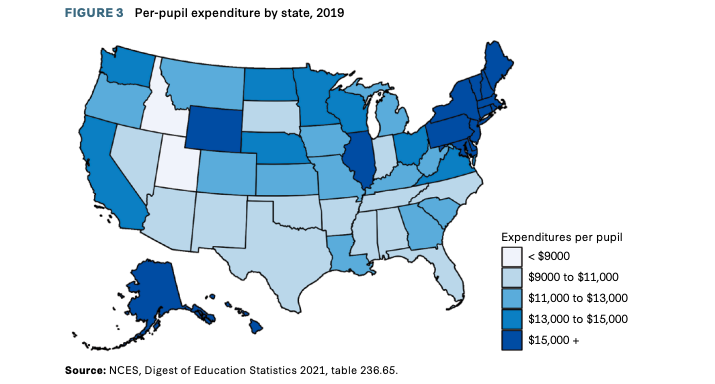
Figure 3 illustrates the distribution of state per-pupil spending levels in the 2018–19 academic year. Northeastern states spend more than $15,000 per student, significantly higher than the $9,000 to $11,000 per pupil spent by the majority of southern states.
Student performance
The United States has reliably assessed student performance with the National Assessment of Educational Progress (NAEP), otherwise known as the Nation’s Report Card. The long-term trend (LTT) assessment of NAEP makes it possible to get representative national data for math and reading performance of students aged nine, thirteen, and seventeen since the 1970s. Beginning in 1992, a second version of NAEP, called Main NAEP, was started with testing of math and reading in grades four and eight.
Table 2 provides data on NAEP testing results both in terms of changes in standard deviations (SD) and in terms of these changes relative to school expenditure. The pre-pandemic results fall into two distinct clusters. There are strong gains in the level of math performance for younger students—age nine (grade four) and to a lesser extent age thirteen (grade eight). But there are much more modest gains for age seventeen math and for reading at all ages.
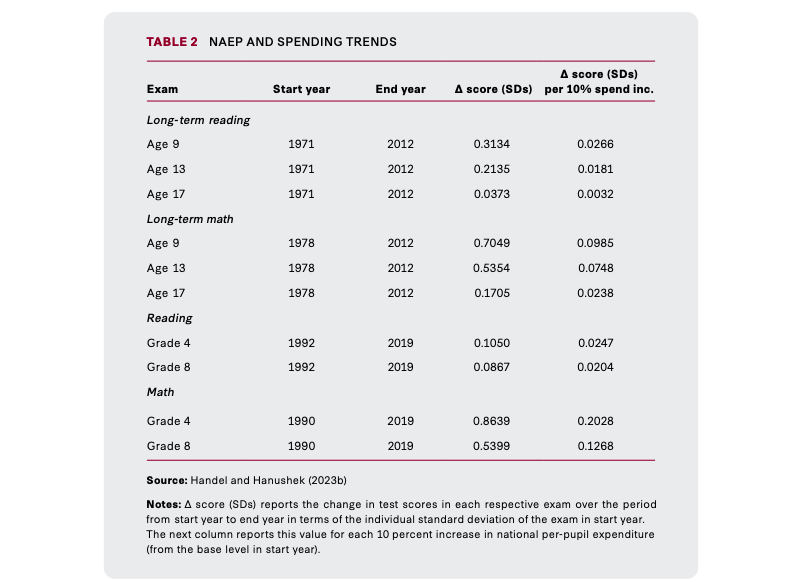
The scores cover different periods of time, so it is also useful within this discussion to place them in comparison to the spending on schools. When normalized by spending over the relevant time periods, the younger cohort math gains are all greater than 0.07 SD per 10 percent larger spending, while the remaining gains are all less than 0.03 SD per 10 percent larger spending.
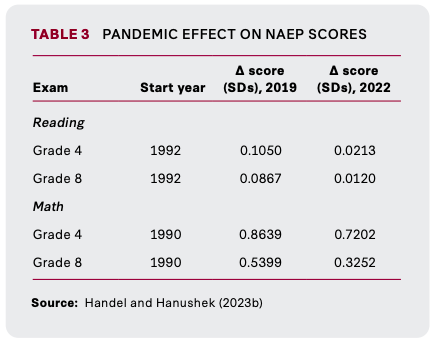
The results were, unsurprisingly, dramatically altered by the COVID-19 pandemic. The MainNAEP had testing in spring 2019 (included in Table 2) and spring 2022. In math and reading for both grade four and grade eight, average scores fell dramatically with the largest declines being recorded for math performance (Table 3). Grade eight (grade four) gains from 1990 through 2022 were down to 0.33 SD (0.72 SD). For reading, virtually all gains since 1992 were erased by the pandemic; the 1992–2022 gain was 0.01 SD for grade eight and 0.02 for grade four. It is of course difficult to know how to interpret the scores after the pandemic. Clearly, the substantial added funds over the pandemic period were insufficient to overcome the learning disadvantages of the pandemic period.
The achievement gains in Table 2 are unconditional changes in student performance. In interpreting this performance data, it is important to note that, because achievement is a function not only of schools but also of parents, peers, and neighborhoods, the data do not indicate the causal impact of schools or spending, but they do provide an important backdrop to finance discussions.
One related pattern that does consider some of the nonschool factors is the historical evolution of achievement gaps by socioeconomic status (SES). Concerns have been raised that the widening of the US income distribution led to expanding SES achievement gaps (Reardon 2011). That concern is unfounded because test information that is linked over time shows a slow shrinking of gaps for birth cohorts born between 1961 and 2001 (Hanushek et al. 2022).
Court involvement
While the federal courts were involved in school funding issues for a while after the school desegregation ruling in Brown v. Board of Education, the US Supreme Court in 1973 declared school finance outside the federal role (Rodriguez v. San Antonio), effectively moving all litigation to state courts.
Litigation in the state courts is filed under the state’s equal protection clause or the state’s education clause as covered by individual state constitutions (see Hanushek and Lindseth 2009). The equity cases under the equal protection clause argue that state efforts to ameliorate either cost of education differences (e.g., for English language learners) or differences in property tax bases are insufficient. The adequacy cases under state education clauses argue that the current level of funding is insufficient to meet the constitutional obligations of the state.
The judicial branch has been asked to assess the level and pattern of school spending in 205 separate court cases adjudicated across forty-eight of the fifty states. There is no distinct geographical pattern to where these court cases have been found. The prevalence of cases is almost evenly split between below-average and above-average spending states, but the success of defendants in maintaining the existing finance structures is relatively greater in low-spending states. Perhaps surprisingly, decisions in cases focused on adequacy tend to be more successful in states that are already at above-average achievement levels as measured by NAEP.
Interestingly, while the court cases are focused on school spending, there is no overall relationship between spending growth and either decisions that favor the plaintiffs or the number of cases in any state. States with mandates from the courts to increase spending average somewhat larger immediate growth (within five years of the decision) than states where there is no such court mandate, but these short-run changes do not lead to differences in long-term growth of spending. Thus, the school finance litigation has occupied the attention of state legislatures across the country, but it has not changed the overall funding outcomes across the states.
74 Interview: Stanford Economist Eric Hanushek on COVID’s Trillion-Dollar Impact on Students
The spending-achievement dilemma
Since the first major study of school resources and student achievement (Coleman et al. 1966), there have been questions about the strength and consistency of any relationship between the two. This very influential study, the Coleman Report, suggested that school resources were not closely related to student outcomes; instead, families and peers had the primary influence. While the study was not well executed by current scientific standards, it evoked a huge response, with many researchers pursuing related questions about the determinants of student achievement.
The early research confirmed the doubts about whether strong impacts on student achievement would follow added spending (Hanushek 2003). But the early research was marked by studies of highly variable quality, and many would not meet current empirical standards. There are a variety of problems faced by this research, but the main problem is that insufficient attention is given to finding the “causal impact” of added funding. In other words, the correlations of resources and achievement could well be affected by other unmeasured factors that bias any empirical analysis.
A more recent body of research has developed that emphasizes careful identification of the causal impact of resources on student outcomes. The ideal approach to investigating the causal impact of resources is a randomized controlled trial where some group of schools is randomly chosen to receive more resources while another group does not. Such a research design is, of course, not really feasible with schools (or in many other circumstances). As a result, a variety of other approaches that are designed to mimic randomized controlled trials have been developed. These approaches have two common elements: the existence of a change in resources that is not correlated with other factors that affect student outcomes and the availability of a control group that can indicate what would happen in the absence of the added resources.
Finding circumstances that meet the requirements for these quasi-experimental approaches is not easy. Observations of most actual school operations do not meet these stringent requirements. In fact, the relevant scientific conditions are relatively unusual. But over the past two decades a number of such circumstances have been uncovered by researchers, lending the possibility that evidence on the causal impact of added resources can be more thoroughly investigated.
The studies falling into this category come from a variety of circumstances, ranging from added funding that results from court decisions in finance cases to the impact of budget decreases following the 2008 recession. Because these studies reflect such a wide range of circumstances, it is difficult to provide a direct comparison of the various estimates, but there are now two reviews of the work over the past two decades (Jackson and Mackevicius 2021; Handel and Hanushek 2023b).
Two general conclusions come from the recent studies:
With high probability, adding resources to schools has a positive effect on student outcomes.
The estimated impact of resources is highly variable and depends on the context and constraints on the spending.
The first conclusion largely underscores the contentious political nature of the research in this area. Nobody believes that adding resources to schools is likely to harm students and learning, but because parts of the research enter directly into legislative and judicial decisions about funding, there has been some effort to make this the focus of attention. By phrasing the issue as “does money matter?” the intent is to set the low hurdle of “no harm.” Of course, rational public decision-making would not fund all public programs that don’t harm the recipients.
The second conclusion of the research is much more relevant. The estimates of spending impacts range from too small to reject the possibility of no impact to very large effects on both student achievement and attainment of more schools. The small estimates would not justify added public expenditure because the costs would exceed the social benefits. The large results, on the other hand, would justify considerable commitment of added public funds.
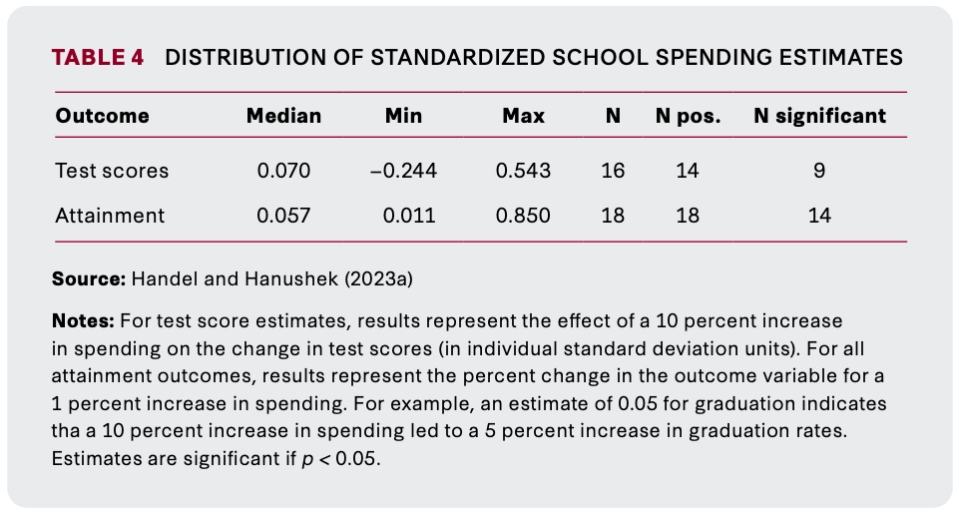
Table 4 provides a summary of the results from the separate studies of student outcomes that meet modern empirical standards for estimating the causal impact of funding. All estimates represent the expected improvement in outcomes for a 10 percent increase in funding. The preferred estimates relate to achievement test scores. While most are positive and nine of sixteen are statistically significant, they vary widely. Part of the variation just represents normal sampling errors that are present in all studies, but most of it represents true differences in the underlying impact of funding. The estimates for test scores range from a reduction in achievement of −0.24 SD (not statistically significant) to +0.54 SD (statistically significant). This large range leaves substantial uncertainty in what can be expected from added funding. Clearly, averaging across these estimates to get a predicted impact would be misleading: in addition to having a small number of estimates in the sample, we could not be confident that they are typical of the full set of funding decisions that have not been measured.
While all of the results for school attainment (high school graduation, not dropping out, and continuing to college) are positive, they also cover a very wide range. They, too, have the same challenges for interpretation.
The major difficulty is that it has not been possible to describe when funds are particularly effective or ineffective (Handel and Hanushek 2023a). The estimated impacts of resources, as noted, come from very different circumstances. They do not reflect differences in the underlying methodology, in whether funds are targeted at a particular group such as disadvantaged students, whether they come from court directives, or whether they reflect differences across states in policies. To date, little headway has been made in describing the features of the particular contexts or the particular use of funds that yields significant learning gains.
In many ways, it is not surprising that the underlying methodology does not provide clear information about the underlying structure of effectiveness. The appeal of randomized controlled trials and quasi-experimental designs is that it is possible to provide causal impact information without knowing or being able to specify the full range of factors that enter into determining the outcomes. But this does not mean that the specific impact estimates are unaffected by the circumstances or even the design of the specific use of resources. The combination of the use of resources and the context within which they are applied is in how funds are used. The current research underscores the importance of how funds are used if student achievement is to be improved.
An ideal funding policy
Education policy has two broad goals: reach high levels of achievement and do this in an equitable manner. The way that we fund schools should clearly relate to meeting these goals. The overall level of funding is a political decision, not a scientific decision. Legislatures decide on funding levels on the basis of both their judgments about reaching the desired learning standards of the state and their views on the trade-offs with other public expenditures and with private expenditures (as related to tax rates). But because the outcomes of the funding depend on how the funds are used, the education policy surrounding any funding cannot be ignored.
A fundamental problem is that we do not have a set of simple policies that can be put in place and that have a high probability of successful impact on student achievement. We know some things that have an impact, but it is often not clear how they can be put in place at scale.
For example, there is extensive information about the importance of effective teachers (e.g., Hanushek 2011; Chetty, Friedman, and Rockoff 2014; Bacher-Hicks and Koedel 2023). Knowing how important teachers are is different from having a clear set of policies that can be legislated and put into place. There are examples of the application of teacher policies that work in some locations, such as Washington, DC (Dee and Wyckoff 2015, 2017) and Dallas (Hanushek et al. 2023). It is nonetheless difficult to legislate adoption of these complex plans that have been honed to the circumstances of the individual areas.
There are institutional structures that tend to promote better achievement—and that are likely to work in part through promoting better teachers. For example, recent evidence points to good overall performance results from allowing the greater flexibility and parental choice that come with charter schools (see CREDO 2023). Yet the details remain difficult to legislate.
In discussing guiding principles for an effective funding system, Hanushek and Lindseth (2009) proposed seven general principles:
If the objective is to improve outcomes, the system should focus on outcomes. Accountability for performance should be substituted for restrictions on local decision-making.
The system should reward those who contribute to success—that is, those who bring about high achievement.
Rewards should be based on each person’s contribution to success and not on external factors such as the education inputs of families and neighborhoods.
School funding formulas should minimize unproductive “gaming” by avoiding rewards for things that are easily manipulated by school personnel.
School funding policies must recognize the underlying heterogeneity of students and their education challenges and ensure that all schools have the means to succeed.
School authorities must gather relevant programmatic and performance data and use it to refine and improve performance.
New policies or programs should be introduced in a manner that enables direct evaluation of their results.
These principles can, of course, be filled in a variety of ways, but they revolve around setting up incentives so that the decision-makers take actions that lead to better student outcomes. An example of the application of these principles is what Hanushek and Lindseth (2009) call “performance-based funding.”
The central elements of such a system, building on what has previously been successful, include a strong accountability system with incentives and direct rewards for successful performance, empowered local decision-making by both schools and parents, and an ongoing information and evaluation system. This would all be built on a rational and equitable base of funding that provides basic support and that recognizes both different abilities of districts to raise revenue and different costs for educating individuals (e.g., for children from poor families and for students with special needs).
Perhaps the key idea, however, is recognizing and rewarding success. Today many public funding programs actually do the opposite: they reward failure. For example, if a school shows poor performance from its students, more funds are provided; if the school shows improvement, funds are reduced. In other words, they provide an incentive for failure, not for success.
Policies based on incentives for outcomes do not call for completely understanding what works and why. They implicitly acknowledge that there might be alternative ways to achieve the same outcomes and that the choices might reflect both differing demands and differing capacities of schools.
Headwinds
An incentive-based funding program faces headwinds from a variety of sources. Perhaps the largest is simply the inertia in the system: “That is not how we do it.” There is a long history of approaches to funding that avoid policies offering direct positive incentives. This history is deeply embedded in both state policies and local decision-making—and leads to a majority of personnel in the current system being happy with the overall structure. Moreover, public views remain supportive of the institutional structure of the public schools. As a result, the system itself resists attempts at alteration.
The strongest force of resistance to change is the teachers’ unions. They, as a matter of principle, push back against any attempt to make policies based on differential performance (Moe 2011). As part of this, they resist accountability of schools and of personnel in general, and they resist linking resources to good performance.
At the same time, the unions do not stand alone. This is perhaps easiest to see in states that do not permit collective bargaining and that still resist changes in terms of accountability and incentives. It is also seen in the fact that right-to-work states do not systematically perform better.
COVID-19 brought new challenges to schools, and it has been common to blame all concerns and policy challenges on the pandemic. In reality, NAEP scores began falling after 2012 and simply continued their slide during the pandemic. The prior falls in scores have hit minorities and disadvantaged students exceptionally hard. The COVID cohort as a group has been seriously harmed by learning losses that accrued during the pandemic (Hanushek 2023). Just getting schools back to their 2020 levels appears to be a major challenge in a range of schools. But if we just get back to 2020, the COVID cohort will be permanently harmed. Eliminating the learning losses for this generation is a major policy challenge, but as described, it is far from the only challenge facing the schools. COVID underscores the urgency of the situation but does not provide a long-run solution.
In another matter that affects budgets but is not closely related to student outcomes, many schools are facing significant budget overhang from their retirement programs. The impact of the retirement system varies widely, depending on state rules on funding and depending in part on the character of prior contract negotiations. Most of these issues are beyond the scope of this discussion—with one exception. There is now evidence that schools tend to put too much teacher compensation into retirement plans that are valued by the teachers as having lower value than salary dollars (Fitzpatrick 2015). Thus, the state funding formula must be sensitive to the incentives sent to districts when they negotiate contracts.
See the full Hoover Institution initiative: A Nation At Risk +40.

