WA has one of the highest workplace injury rates in the U.S. But is that really a problem?
In our Reality Check stories, Bellingham Herald journalists seek to hold the powerful accountable and find answers to critical questions in our community. Read more. Story idea? newsroom@bellinghamherald.com.
At first glance, Washington’s workplace injury numbers are alarming. According to the Bureau of Labor statistics, the state saw 3.9 injuries and illnesses for every 100 full-time workers, tied for the second highest rate of any state in the country. When you factor in government workers, that number rises to 4.3.
The only state to rank higher was Maine, at 4.9, while California (4.2) and Oregon (4.0) placed just below Washington according to the Ohio-based Fitch Law Firm’s analysis of the data. This wasn’t a fluke, Washington’s workplace injury rate has been well above the national average for the past two decades, according to the state’s Department of Labor and Industries.
Much of Washington’s high rate can be attributed to its state government, which had 9.3 workplace injuries per 100 workers in 2022. That was the highest rate of any single industry in any state, according to Fitch Law Firm’s analysis. When you factor in local government, that number falls to 7.7, but it’s still the highest public sector injury rate of any state, according to the BLS.
Does WA really have a problem?
But does the state really have a workplace injury problem? The answer to that is a little complicated. According to Dave Bonauto, who leads a workplace safety research program at the Washington State Department of Labor and Industries, workplace injury data can be inconsistent across different states.
“There is generally underreporting of non-fatal occupational injuries and illness to the BLS [Survey of Ocupational Illnesses and Injuries] by employers,” Bonauto said in an email. “It seems likely that there is variation in underreporting across states. The extent of underreporting may be based on the understanding and enforcement of OSHA record-keeping rules within a state and on other factors.”
WA’s unique workers’ comp structure
Washington tends to have a higher rate of injuries that get reported due to its unique workers’ compensation structure, according to University of Washington professor emeritus Richard Gleason, who specializes in workplace safety. It’s one of four states where insurance is purchased through the state, and is the only state where employees contribute to their own workers’ compensation. Both of these factors give employers fewer disincentives to report workplace injuries, Gleason said.
“In Washington you’re much more prone to put something down on your OSHA log of injuries and illnesses because L&I already paid the claim,” Gleason said in an interview.
In addition to Washington’s workers’ compensation program, the Department of Labor and Industries oversees the Division of Occupational Safety and Health, which tracks workplace injury data. Having both departments under the same roof makes injuries that turn into workers’ compensation claims more likely to be recorded.
“See, when federal OSHA comes out, they don’t know anything about your industry and they’re not allowed to look through workers comp rates or claims, so they can only look at your OSHA log,” Gleason said. “But in Washington, since L&I has both DOSH, it’s the Washington state OSHA, and workers’ comp, they’re both in the same department.”
Bonauto added that the state’s low wait times for workers’ compensation claims have an affect too.
“An observation from a respected researcher is that states where a worker has to wait seven days before claiming workers compensation time loss benefits have reported non-fatal rates on the BLS survey that are 30-40% lower than states with a 3 day waiting period, such as Washington,” Bonauto said.
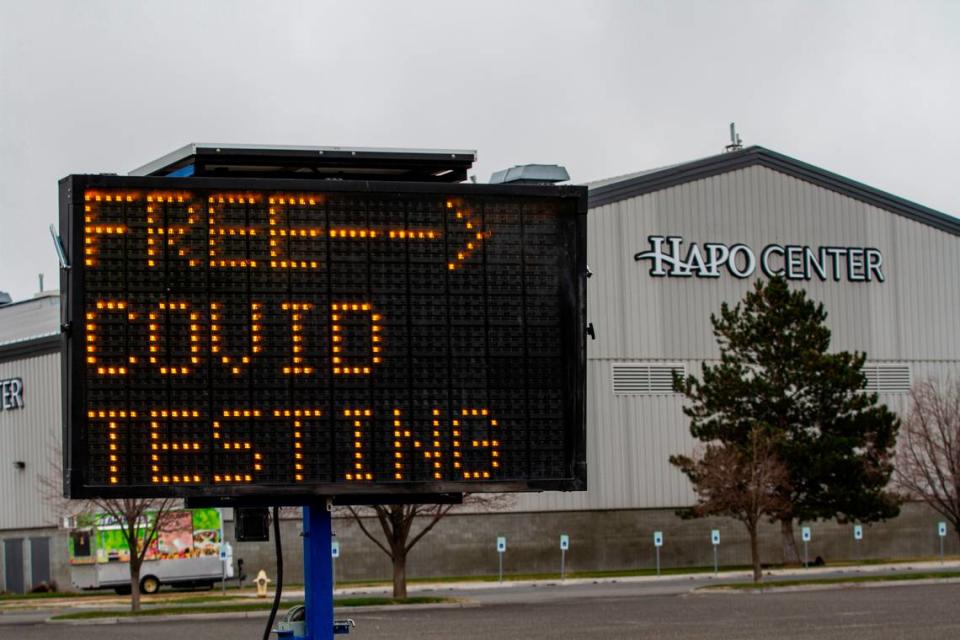
The affects of COVID testing
As for the state’s injury and illness rate among government employees, that number jumped from 5.3% in 2019 to 7.7% in 2022, signaling that it was influenced by COVID-19 cases, which are included in workplace injury and illness counts. But Gleason said that’s more a result of Washington testing its public employees for COVID more frequently and later into the pandemic than many other states.
“The more you test, the more you find,” Gleason said. “And then it had to go on the OSHA log.”
The injury and illness rate in the private sector was less affected by the pandemic, though. It’s almost exactly on par with its pre-pandemic levels according to L&I data.
What about workplace fatalities?
Instead, both Gleason and Ross suggested looking at workplace fatality rates for a more accurate picture of how safe each state is for its workers.
“Fatalities don’t lie,” Gleason said.
In 2021, Washington had the third-lowest rate of workplace fatalities at 2.1 deaths for every 100,000 workers, according to the AFL-CIO’s most recent “Death on the Job” report. The national average was 3.6.
Washington has been well below the national average in workplace deaths every year since 2007, according to the AFL-CIO, with the exception of 2010 when it was only slightly less than the average.
While the AFL-CIO’s report on 2022 worker deaths isn’t out yet, the BLS recorded 104 worker deaths that year. Assuming Washington had a similar number of total workers in 2022, that would put its fatality rate nearly 50% higher at 3.1 deaths per 100,000 workers, much closer to the national average.
According to Bonauto, all this data taken together paints the picture that there’s “more complete reporting of workplace injuries in Washington – or less underreporting as compared to other states.”

