The Yearly Salary Needed to Buy a Home in the U.S. Increased 50% Since 2020

The annual income needed to buy a home in the U.S. has hit an all-time high, with monthly mortgage rates and housing costs skyrocketing across the country.
According to a recent report by real estate site Redfin, the yearly salary needed to afford a median-priced home in America is now $114,627, up 15 percent from last year and more than 50 percent since the beginning of the pandemic. For context, the average household income was about $75,000 in 2022. Of course, affordability can fluctuate depending on what part of the country you’re living in. Specifically, the analysis found that necessary income has increased in every major metro area throughout the nation, with the biggest surge seen in cities such as Miami, Florida.
More from Robb Report
In a Leafy L.A. Suburb, This Revamped Midcentury Modern Is Primed for the Spotlight
The Weeknd's Manager Splashed Out $10 Million on This Stunning L.A. Estate
“In a homebuyer’s ideal world, rising mortgage rates would push demand and home prices down enough to make up for high interest payments. But that’s not what’s happening now,” explains Redfin economics research lead Chen Zhao in the report. “Although new listings are ticking up slightly, inventory is still near record lows as homeowners hang onto their low mortgage rates—and that’s propping up prices.”
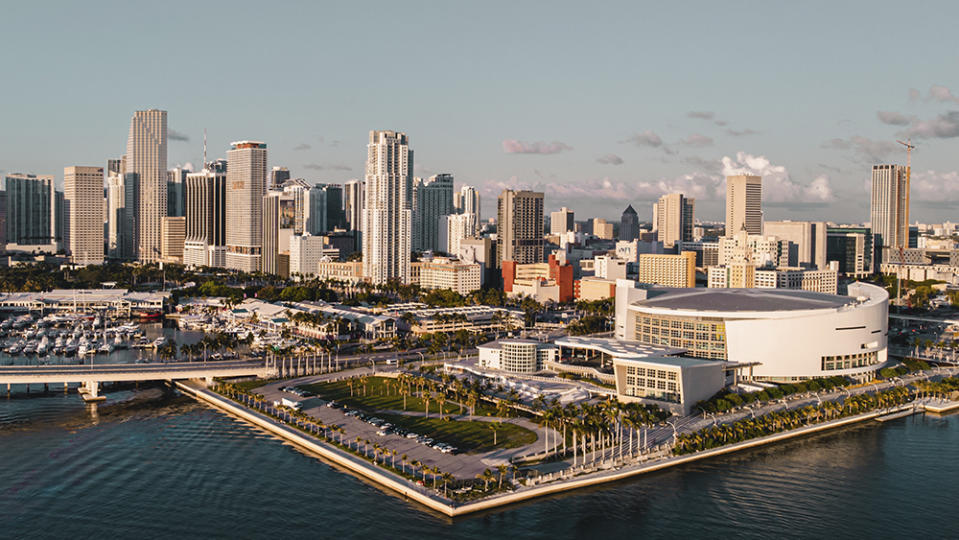
In Miami, where the average mortgage payment is now $3,580, the annual income needed to buy a typical home increased 33 percent to $143,000. The brokerage also found that buyers across four other eastern metros need to make at least 30 percent more than they did a year ago to afford a median-priced home. Those locales include Bridgeport, Connecticut ($183,000); Dayton, Ohio ($60,000); Rochester, New York ($66,000); and Hartford, Connecticut ($95,000).
Unsurprisingly, the two priciest metros in the country are in California. Bay Area residents looking to snap up a median home in San Jose or San Francisco will have to earn approximately 25 percent more than they did last year. Meaning, buyers will have to make between $404,332 and $402,287, respectively, to afford a home.
Zhao’s advice? “Buyers—particularly first-timers who are committed to getting into a home now—should think outside the box,” she says. “Consider a condo or townhouse, which are less expensive than a single-family home, and/or consider moving to a more affordable part of the country or a more affordable suburb.”
You can check out the full A to Z list of cities below.
U.S. metro area | Annual income required to afford median-priced home | YoY change, annual income required to afford median-priced home | Median monthly mortgage payment | Median home-sale price |
Akron, OH | $59,702 | 18.4% | $1,493 | $218,900 |
Albany, NY | $87,276 | 26.0% | $2,182 | $320,000 |
Allentown, PA | $88,639 | 23.2% | $2,216 | $325,000 |
Anaheim, CA | $300,010 | 28.6% | $7,500 | $1,100,000 |
Atlanta, GA | $107,731 | 19.4% | $2,693 | $395,000 |
Austin, TX | $126,208 | 7.7% | $3,155 | $462,748 |
Bakersfield, CA | $100,258 | 22.2% | $2,506 | $367,600 |
Baltimore, MD | $103,640 | 21.1% | $2,591 | $380,000 |
Baton Rouge, LA | $71,184 | 21.5% | $1,780 | $261,000 |
Birmingham, AL | $76,912 | 16.3% | $1,923 | $282,000 |
Boise City, ID | $126,869 | 9.1% | $3,172 | $465,170 |
Boston, MA | $194,188 | 22.7% | $4,855 | $712,000 |
Bridgeport, CT | $182,734 | 32.1% | $4,568 | $670,000 |
Buffalo, NY | $70,093 | 25.1% | $1,752 | $257,000 |
Camden, NJ | $91,367 | 27.8% | $2,284 | $335,000 |
Cape Coral, FL | $108,249 | 16.9% | $2,706 | $396,900 |
Charleston, SC | $112,231 | 17.9% | $2,806 | $411,500 |
Charlotte, NC | $108,822 | 16.0% | $2,721 | $399,000 |
Chicago, IL | $91,367 | 25.7% | $2,284 | $335,000 |
Cincinnati, OH | $77,730 | 27.5% | $1,943 | $285,000 |
Cleveland, OH | $61,536 | 22.1% | $1,538 | $225,625 |
Columbus, OH | $90,276 | 23.8% | $2,257 | $331,000 |
Dallas, TX | $115,913 | 15.0% | $2,898 | $425,000 |
Dayton, OH | $60,002 | 31.2% | $1,500 | $220,000 |
Denver, CO | $158,187 | 17.3% | $3,955 | $579,999 |
Des Moines, IA | $79,094 | 25.0% | $1,977 | $290,000 |
Detroit, MI | $51,793 | 19.4% | $1,295 | $189,900 |
El Paso, TX | $69,548 | 23.6% | $1,739 | $255,000 |
Elgin, IL | $92,730 | 27.6% | $2,318 | $340,000 |
Fort Lauderdale, FL | $114,549 | 22.2% | $2,864 | $420,000 |
Fort Worth, TX | $98,185 | 13.2% | $2,455 | $360,000 |
Frederick, MD | $145,407 | 18.1% | $3,635 | $533,140 |
Fresno, CA | $114,275 | 23.4% | $2,857 | $418,995 |
Gary, IN | $72,125 | 18.3% | $1,803 | $264,450 |
Grand Rapids, MI | $88,639 | 24.0% | $2,216 | $325,000 |
Greensboro, NC | $76,503 | 23.1% | $1,913 | $280,500 |
Greenville, SC | $87,821 | 18.9% | $2,196 | $322,000 |
Hartford, CT | $94,640 | 30.2% | $2,366 | $347,000 |
Honolulu, HI | $188,188 | 15.9% | $4,705 | $690,000 |
Houston, TX | $92,185 | 15.6% | $2,305 | $338,000 |
Indianapolis, IN | $81,794 | 23.7% | $2,045 | $299,900 |
Jacksonville, FL | $99,549 | 15.2% | $2,489 | $365,000 |
Kansas City, MO | $89,185 | 23.1% | $2,230 | $327,000 |
Knoxville, TN | $102,276 | 28.1% | $2,557 | $375,000 |
Lake County, IL | $95,458 | 28.9% | $2,386 | $350,000 |
Lakeland, FL | $88,639 | 13.4% | $2,216 | $325,000 |
Las Vegas, NV | $113,186 | 14.9% | $2,830 | $415,000 |
Little Rock, AR | $62,729 | 13.9% | $1,568 | $230,000 |
Los Angeles, CA | $237,281 | 19.8% | $5,932 | $870,000 |
Louisville, KY | $73,612 | 20.8% | $1,840 | $269,900 |
McAllen, TX | $68,184 | 29.8% | $1,705 | $249,999 |
Memphis, TN | $79,094 | 16.3% | $1,977 | $290,000 |
Miami, FL | $143,187 | 33.4% | $3,580 | $525,000 |
Milwaukee, WI | $87,548 | 28.8% | $2,189 | $321,000 |
Minneapolis, MN | $103,640 | 19.5% | $2,591 | $380,000 |
Montgomery County, PA | $130,886 | 28.3% | $3,272 | $479,900 |
Nashville, TN | $124,095 | 19.0% | $3,102 | $455,000 |
Nassau County, NY | $177,279 | 20.0% | $4,432 | $650,000 |
New Brunswick, NJ | $141,823 | 26.9% | $3,546 | $520,000 |
New Haven, CT | $91,367 | 21.8% | $2,284 | $335,000 |
New Orleans, LA | $75,003 | 15.1% | $1,875 | $275,000 |
New York, NY | $197,734 | 20.5% | $4,943 | $725,000 |
Newark, NJ | $159,551 | 33.4% | $3,989 | $585,000 |
North Port, FL | $123,888 | 17.4% | $3,097 | $454,240 |
Oakland, CA | $249,554 | 17.0% | $6,239 | $915,000 |
Oklahoma City, OK | $71,457 | 19.1% | $1,786 | $262,000 |
Omaha, NE | $83,185 | 25.8% | $2,080 | $305,000 |
Orlando, FL | $108,597 | 18.5% | $2,715 | $398,175 |
Oxnard, CA | $233,190 | 23.6% | $5,830 | $855,000 |
Philadelphia, PA | $75,003 | 16.3% | $1,875 | $275,000 |
Phoenix, AZ | $121,368 | 13.6% | $3,034 | $445,000 |
Pittsburgh, PA | $64,639 | 22.5% | $1,616 | $237,000 |
Portland, OR | $149,023 | 15.6% | $3,726 | $546,400 |
Providence, RI | $125,459 | 28.9% | $3,136 | $460,000 |
Raleigh, NC | $120,004 | 17.4% | $3,000 | $440,000 |
Richmond, VA | $102,276 | 24.6% | $2,557 | $375,000 |
Riverside, CA | $151,369 | 17.6% | $3,784 | $555,000 |
Rochester, NY | $65,866 | 30.7% | $1,647 | $241,500 |
Sacramento, CA | $156,824 | 17.8% | $3,921 | $575,000 |
Salt Lake City, UT | $139,096 | 13.0% | $3,477 | $510,000 |
San Antonio, TX | $87,273 | 14.5% | $2,182 | $319,990 |
San Diego, CA | $241,372 | 28.7% | $6,034 | $885,000 |
San Francisco, CA | $404,332 | 23.2% | $10,108 | $1,482,500 |
San Jose, CA | $402,287 | 24.8% | $10,057 | $1,475,000 |
Seattle, WA | $214,904 | 18.3% | $5,373 | $787,956 |
St. Louis, MO | $70,912 | 21.0% | $1,773 | $260,000 |
Stockton, CA | $144,550 | 15.2% | $3,614 | $530,000 |
Tacoma, WA | $149,855 | 17.7% | $3,746 | $549,450 |
Tampa, FL | $103,613 | 17.3% | $2,590 | $379,900 |
Tucson, AZ | $99,549 | 21.3% | $2,489 | $365,000 |
Tulsa, OK | $69,548 | 23.6% | $1,739 | $255,000 |
Virginia Beach, VA | $93,003 | 25.9% | $2,325 | $341,000 |
Warren, MI | $82,571 | 21.4% | $2,064 | $302,749 |
Washington, DC | $150,005 | 23.0% | $3,750 | $550,000 |
West Palm Beach, FL | $125,459 | 24.4% | $3,136 | $460,000 |
Wilmington, DE | $90,412 | 21.5% | $2,260 | $331,500 |
Worcester, MA | $118,640 | 23.4% | $2,966 | $435,000 |
Best of Robb Report
Sign up for Robb Report's Newsletter. For the latest news, follow us on Facebook, Twitter, and Instagram.

