The USDA Released a New Hardiness Zone Map—Here’s What It Means for Your Garden
It's way more useful this year
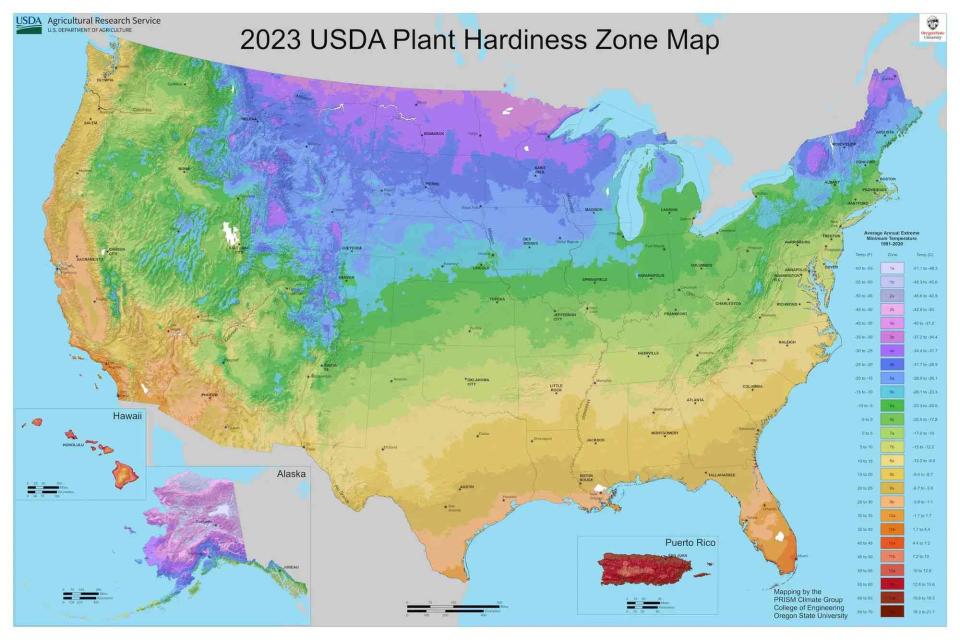
US Department of Agriculture
The USDA recently released a new Plant Hardiness Zone Map, and although you may have used the interactive map in the past, it got its first full revamp in over a decade.
The new map provides valuable insights for gardeners that just might alter the way they plan and schedule their plantings. Recently released by the U.S. Department of Agriculture, the revamped Plant Hardiness Zone Map interactive map is a total game-changer for garden enthusiasts.
Insights From the New Map
Christopher Daly, director of the PRISM Climate Group and the map's lead author told PHYS News that the 2023 map is about 2.5 degrees warmer than the previous 2012 maps across the conterminous United States.
This warming trend translates into a significant shift, with approximately half of the country moving to a warmer five-degree half zone while the other half remains in the same half zone. Notably, the central plains and Midwest have experienced the most substantial warming, whereas the southwestern U.S. has seen minimal changes.
Implications for Gardeners
For gardeners, this shift might seem modest, but it actually carries some considerable implications, especially how it relates to the first frost date in your area. Figuring out that first frost date—which often freezes and kills our plants—is vital for deciding when to bring vulnerable plants indoors or prepare the garden for the changing season.
Frost can damage all your plants, but young and newly planted plants are particularly vulnerable to the cold because the new growth is sensitive. However, it's also important to understand the difference between how a frost affects plants in comparison to a freeze—some of your plants might be able to handle the former, but not the latter. Additionally, the updated map expands beyond perennials, which you’ll probably never want to bring inside, anyway.
Zone numbers, a familiar feature in plant catalogs and nurseries, denote the cold tolerance of perennials. If you’re not sure about the zone you’re planting in, all you have to do is enter the zip code.
The map categorizes zones based on the average annual extreme minimum winter temperature, ranging from the coldest Zone One to the warmest Zone 13, with 10-degree intervals. Each zone is further divided into "a" and "b" half zones, offering a nuanced understanding of temperature variations.
New and Improved
Daly emphasized that the accuracy of the updated map stems from the addition of new stations and advanced mapping techniques, utilizing the latest PRISM technology. These improvements have not only enhanced the precision of the Plant Hardiness Zone Map but have also introduced localized changes unrelated to climate shifts.
To assist gardeners in adapting to these changes, the USDA webpage featuring the map includes a series of informative videos titled "Tips for Growers." These videos guide gardeners in selecting appropriate plants, maintaining their health, and even exploring the art of plant breeding in light of the evolving climate and zone adjustments.
No matter how you're planning to protect your plants this winter, the data-first map is sure to be a great help.
Read Next: How to Use Cold Frames to Protect Your Garden All Winter Long
Read the original article on The Spruce.

