These are the most on-time airlines, ranked
OAG, a data platform for the worldwide travel industry, recently released their collected information on airline arrival times, ranking airlines in order of most on-time to least.
A flight is considered on-time if it arrives within 15 minutes of its scheduled arrival. OAG collected data from the airlines for its rankings, per The Washington Post.
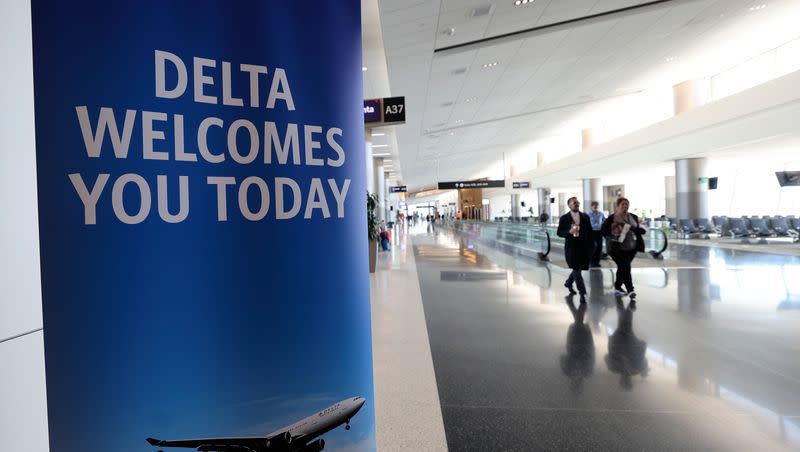
Delta Air Lines was considered to be the most punctual, arriving on time 83.21% of the time, according to OAG.
The on-time performance was notable amid a challenging year for airlines. The year began with a Federal Aviation Administration system outage in January, resulting in the first nationwide air traffic halt since the Sept. 11, 2001, attacks, per The Washington Post.
Airlines also contended with a shortage of air traffic controllers, prompting schedule adjustments. Additionally, severe weather disrupted flights in New York and other locations during the summer.
Top 20 largest global airlines ranked by on-time performance
Taken from OAG, each airline on the list below includes the number of flights and overall percentage of on-time arrivals. Airlines in bold are North American companies.
Delta Air Lines – 1,635,526 flights – 83.21% on-time arrivals.
LATAM Airlines Group – 513,172 flights – 82.74% on-time arrivals.
Azul Airlines – 306,992 flights – 82.39% on-time arrivals.
IndiGo – 661,818 flights – 82.17% on-time arrivals.
All Nippon Airways – 374,321 flights – 81.63% on-time arrivals.
Japan Airlines – 309,328 flights – 81.38% on-time arrivals.
Alaska Airlines – 405,337 flights – 81.04% on-time arrivals.
American Airlines – 1,998,376 flights – 79.11% on-time arrivals.
United Airlines – 1,503,635 flights – 78.67% on-time arrivals.
Aeromexico – 201,627 flights – 76.61% on-time arrivals.
Southwest Airlines – 1,461,535 flights – 75.51% on-time arrivals.
KLM-Royal Dutch Airlines – 240,330 flights – 74.64% on-time arrivals.
China Eastern Airlines – 811,414 flights – 70.23% on-time arrivals.
Spirit Airlines – 298,288 flights – 69.45% on-time arrivals.
SAS Scandinavian Airlines – 209,017 flights – 68.95% on-time arrivals.
Air France – 286,586 flights – 68.33% on-time arrivals.
JetBlue Airways Corporation – 334,833 flights – 68.25% on-time arrivals.
Deutsche Lufthansa AG – 363,719 flights – 67.58% on-time arrivals.
Easyjet – 540,485 flights – 65.26% on-time arrivals.
British Airways – 296,656 flights – 60.92% on-time arrivals.
Top 20 largest North American airports ranked by on-time performance
OAG also collected departure times from airports (apt), noting the number of flights and overall percentage of on-time departures (OTD).
Minneapolis/St Paul International Apt (MSP) – 290,816 flights – 82.57% OTD.
Seattle-Tacoma International Apt (SEA) – 401,049 flights – 82.50% OTD.
Atlanta Hartsfield-Jackson International Apt (ATL) – 745,534 flights – 81.86% OTD.
Charlotte (CLT) – 485,612 flights – 80.39% OTD.
Washington Ronald Reagan National Apt (DCA) – 294,563 flights – 79.63% OTD.
Chicago O’Hare International Apt (ORD) – 680,355 flights – 78.82% OTD.
Phoenix Sky Harbor International Apt (PHX) – 392,198 flights – 78.55% OTD.
Houston George Bush Intercontinental (IAH) – 392,756 flights – 78.28% OTD.
Los Angeles International Apt (LAX) – 507,915 flights – 77.97% OTD.
New York LaGuardia Apt (LGA) – 361,529 flights – 77.59% OTD.
Dallas Dallas/Fort Worth International Apt (DFW) – 660,531 flights – 77.53% OTD.
Denver International Apt (DEN) – 640,097 flights – 76.93% OTD.
Newark Liberty International Apt (EWR) – 401,198 flights – 75.68% OTD.
Miami International Apt (MIA) – 351,525 flights – 75.65% OTD.
San Francisco (SFO) – 347,039 flights – 75.57% OTD.
New York John F. Kennedy International Apt (JFK) – 444,809 flights – 74.31% OTD.
Boston Edward L. Logan International Apt (BOS) – 365,319 flights – 72.96% OTD.
Las Vegas McCarran International Apt (LAS) – 424,032 flights – 72.18% OTD.
Orlando International Apt (MCO) – 386,079 flights – 71.41% OTD.
Toronto Lester B. Pearson International (YYZ) – 348,261 flights – 63.13% OTD.
The Minneapolis/St. Paul, part of Seattle-Tacoma, and Atlanta Hartsfield-Jackson Airports are Delta Airlines hubs, possibly helping Delta rank number one in arrival times.
What else should you know about Delta?
A Delta Airlines flight scheduled to depart from Amsterdam to Detroit turned back midway after maggots were found aboard.
Related
Business Travel News recently released its annual survey of corporate travel buyers and declared Delta the top airline for the 13th year running.
Related
Fewer travelers are eligible to use Delta airport lounges after changes in Sept. 2023. However, there will be revised changes going into effect Feb. 1, 2025, after backlash.
Related

