Is it getting warmer? What the USDA's new plant hardiness map means for your garden
At last. Finally, there’s an updated official government resource out there that gardeners all across the land can blame for any failed planting efforts.
OK, maybe not for all failed plantings, but at least there’s one more arrow in the gardener’s quiver to help us all be a bit more successful in our efforts.
After many years of analyzing gigantic reams of meteorological data, consulting the weather rock on the front lawn of the USDA building in Beltsville, Maryland and dusting off the official government-issued Ouija board, our friends at the United States Department of Agriculture have issued a long-awaited update to the cold hardiness zone map.
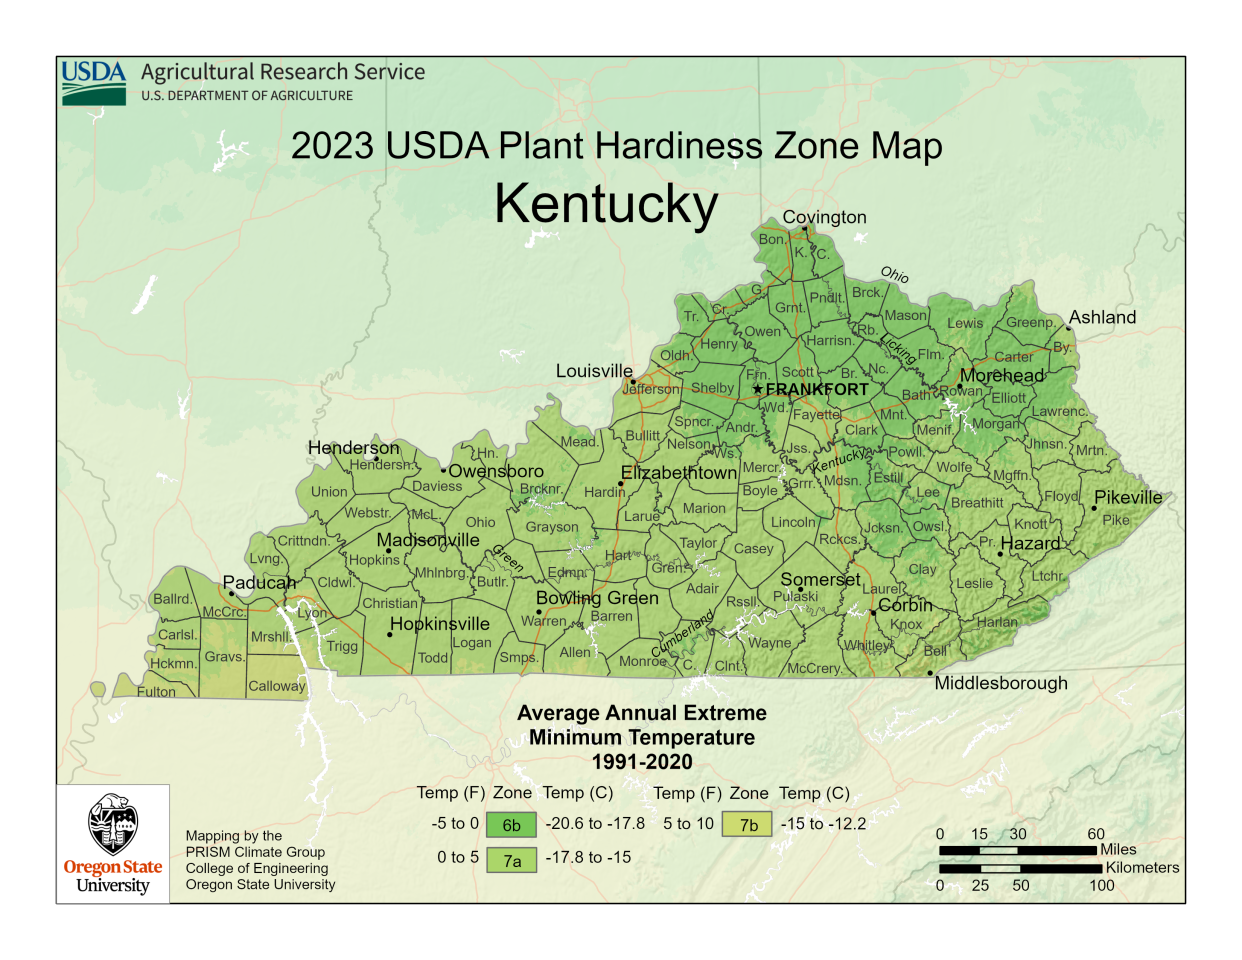
If you’re not familiar with the map, it is a graphic representation of the United States broken into 26 zones based on average annual minimum temperature. For decades, this map has been used by gardeners to determine what plants might have a chance and which selections don't have a prayer in any particular patch of US dirt. It’s become an industry standard that makes gardening feel a bit less like you’re staring down the barrel of Dirty Harry’s 44 magnum ― “Do you feel lucky, Punk?”
What is the USDA cold hardiness zone map?
A little history. Since the dawn of time, gardeners have asked a simple question, “will that grow here?” And for just as long, the most common answer was probably, “I dunno. Give it a try . . .” Then, back in the 1920s, an enterprising group at Harvard University’s Arnold Arboretum decided to create a map that would at least help out on the winter survival part of that age-old question. They mapped out zones across the US to give gardeners some idea of how cold it generally gets during a typical winter. And over time gardeners and the garden plant industry have adopted these zones as almost part of a plant’s name. "Does anybody have any Zone 6 camellias for sale?" for example
After a few iterations, USDA scientists revised, updated, and simplified the effort with their first USDA Cold Hardiness Zone Map published in 1960. This map, now much revised and offered in ever-increasing detail, has become the generally accepted standard by home gardeners and horticulture professionals across the US.
How many zones are in the USDA cold hardiness map?
As of the most recent release, the November 2023 map has the US broken into 13 cold hardiness zones in 10-degree Fahrenheit intervals, with each zone further broken into “a” (the warmer half) and “b” (the colder half) sub-zones. The coldest parts of Alaska represent zone 1a where average annual minimum temperatures fall between -60 and -55 degrees F. (Yeah, that’s pretty much the North Pole.)
With this 2023 map revision, my own Louisville garden sits in zone 7a with an average low temperature falling between 0 and 5 degrees F. The warmest zone, 13b, covers areas where the mean annual minimum temperature doesn’t normally drop below 65 degrees F. Sign me up for that one!
A closer inspection of the exquisitely detailed 2023 hardiness zone map provides even more information. Due to the urban heat island impacts in Louisville, my zone 7a home garden sits in a different cold hardiness zone than Yew Dell Botanical Gardens (6b), just a 20-minute drive down the road. You can check out your zone rating by going to planthardiness.ars.usda.gov/ and entering your zip code.
What does the cold hardiness map measure?
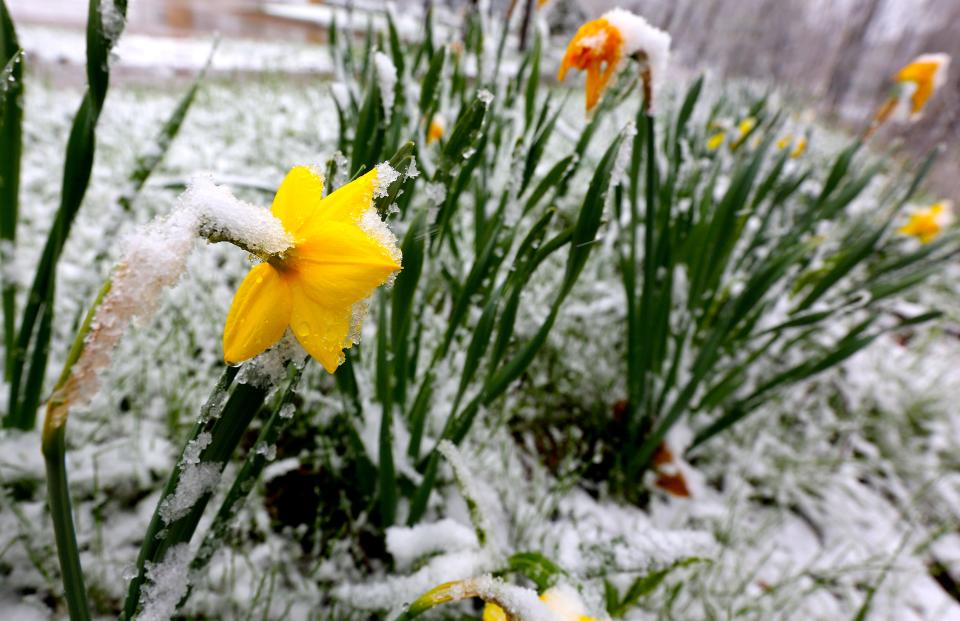
Here’s the thing most people miss with the whole cold hardiness map thing. The zones represent mean annual minimum temperature, not the minimum temperature. So in my now zone 7a Kentucky garden (it was 6b in the last version of the map) there’s nothing that says my plants won’t encounter an occasional -3 or -5 or -8, as was the case in the late 2022 polar blast that nuked so many plants across the city. It just means that on average, that won’t happen all that often. Remember, the record low temperature in Louisville, Kentucky is in the -20s!
So as gardeners, how do we use the cold hardiness zone map? With caution! Averages can be misleading.
I grew up in the New York City area that the current map conveniently ranks as zone 7a — the same as my Louisville, KY garden. Yet the low-temperature record in New York is nearly 10 degrees warmer than the Louisville record. How can that be if both cities are in the same cold hardiness zone?
Variation.
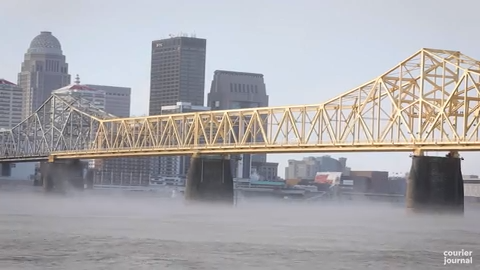
New York City sits right smack on the edge of the Atlantic Ocean — a gigantic thermo-moderating influence that is absent from middle America. Out here in Kentucky, all it takes is for a mosquito to sneeze and the jet stream drops down from Indianapolis and we’re all in trouble. Coastal zones tend to have smaller temperature swings due to the moderating influence of the massive volume of water sitting in the oceans. The Ohio River just doesn’t have enough water to make much of a difference.
Every plant has a temperature below which there remains little chance for survival. Every plant also has a temperature range that will result in partial damage but not outright death. And each plant has a temperature above which all is good and fine. But of course, all those temperature points depend on the plant being in perfect health, growing under perfect conditions, and providing those testing temperatures show up at normal times. Color outside those lines and all you can do is wait it out and see what shows up on the other side.
If you are the kind of gardener who doesn’t like surprises, best to be conservative on your plant selections and not push hardiness zones. If you live in zone 6b and plant zone 6 rated plants, you’re probably just fine about 90% of the time. But if you’re a zone pusher when it comes to selecting your garden plants “You have to ask yourself, do I feel lucky? Well, do ya, punk?”
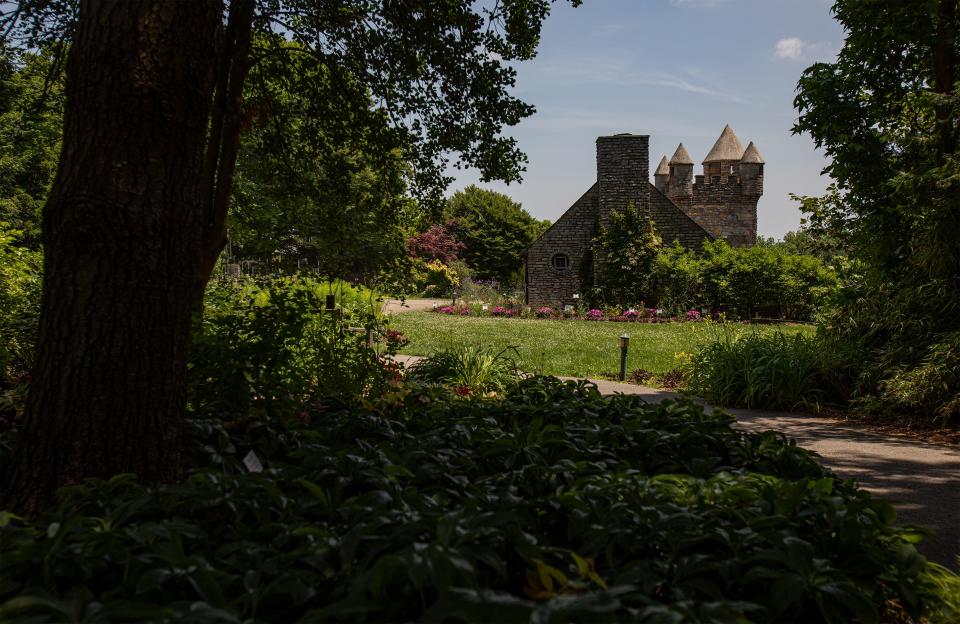
Paul Cappiello is the executive director at Yew Dell Botanical Gardens, 6220 Old Lagrange Road, yewdellgardens.org.
This article originally appeared on Louisville Courier Journal: USDA plant hardiness map 2023 updates

