Garmin’s fitness and health-tracking metrics explained - understand what your smartwatch is telling you
There is a wealth of wearable sports devices offering insight into our heart rate, breathing, recovery, training, and health. Of the brands competing in this sphere, Garmin is one of the largest and best known - but what are the metrics that Garmin’s smartwatches actually track? And what are those measurements really telling you?
I’ve been training with a Garmin Fenix 7, one of the best smartwatches we’ve tested and one of Garmin’s top models. Here I’ll take you through the biomarkers Garmin monitors and help you better understand what all those numbers mean for your training and recovery.
Resting Heart Rate
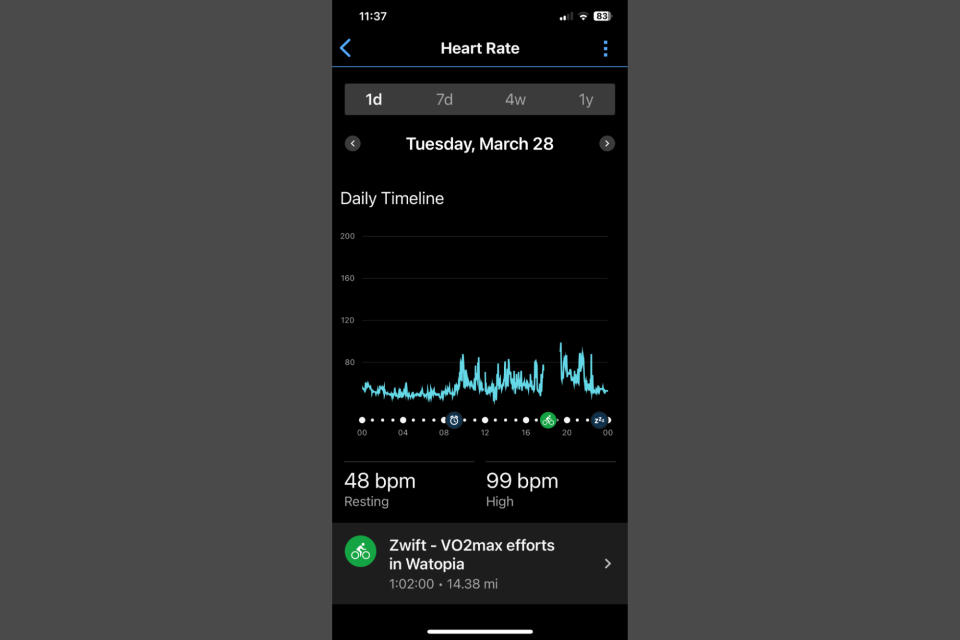
Your Resting Heart Rate (RHR) is the number of beats per minute (BPM) your heart performs while at rest. Elevated levels can indicate a loss of fitness or that you are ill, fatigued or lacking in sleep. Normally, a healthy adult will have a RHR of between 60-100 BPM. However, some of the top endurance athletes have been found to have a RHR of less than 30!
A lower RHR can indicate that you have a stronger heart and/or are better at extracting oxygen from the air, through your lungs, blood, and into tissue. With a large stroke volume, fewer beats are required to transport the same amount of oxygen. With better oxygen utilisation, we require less blood to be pumped around - so it can be a useful indicator of aerobic fitness.
The way the Garmin Fenix measures this is using an array of green LED lights on the underside of the watch. This is reflected off the red blood cells and can show when your heart beats. Several studies have questioned the accuracy of wrist based HR monitors, but the Garmin line has been found to be above 95 per cent accurate at reading HR at lower intensities (with some variance at higher intensities).
Heart Rate Variability
Heart Rate Variability (HRV) is a sign of how well your body’s sympathetic and parasympathetic nervous systems are functioning. Unpacking that a little bit, ‘parasympathetic’ refers to the system which slows your heart rate down, whereas ‘sympathetic’ refers to the system that increases your heart rate as part of the fight or flight response.
Ideally, we want both to be active and having input on our body - rather than one system being more dominant than the other. When you have a good balance between the two systems, there is actually greater variability in the time gap between your heart beats - hence the metric of Heart Rate Variability (HRV), which is measured in milliseconds.
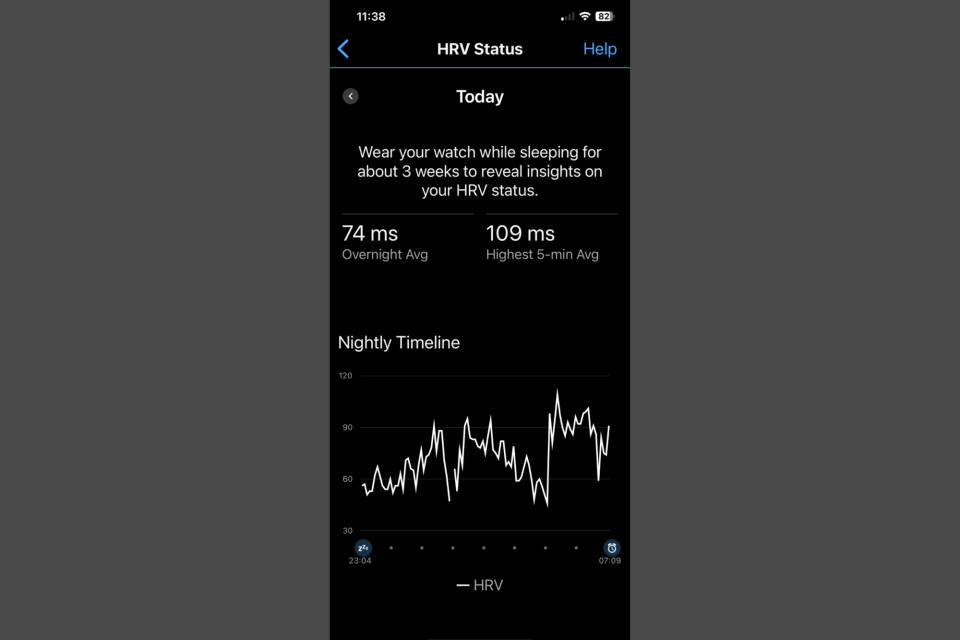
There is generally a good range for each individual person, often coming in between 50-100ms. When your HRV is lower, this suggests that your stress levels are elevated, or that an illness is coming, or that your sleep is impaired. The Garmin Fenix can also give a measurement for your overall ‘Stress’ by conducting a three minute test in which you stand still and HRV is measured. The Stress score that the smartwatch determines comes in on a scale between 1 and 100.
The Garmin Fenix only measures HRV during sleep or the Stress test, and it requires the device to be worn for 3 weeks consecutively in order to gather an accurate baseline. The watch will then give you a 7-day average score of Green (HRV within range), Orange (HRV a bit above or below), or Red (HRV well out of range).
However, it’s worth noting that in our HRV article by Marco Altini, it’s suggested that rather than automatic measurements, we are better off taking manual ones first thing in the morning while seated to get an accurate comparison of HRV from day to day - this is where performing the Stress test could be most useful for us.
Body Battery
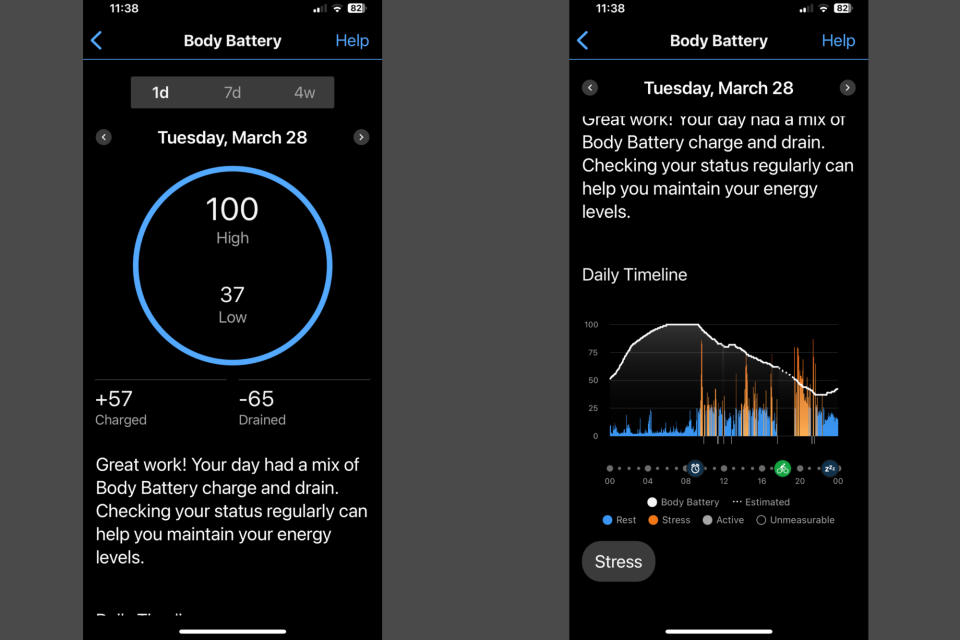
Linked to HRV, the Garmin Fenix can also give you a measure of your ‘Body Battery’. This is done using a combination of HRV, Stress score, sleep quality, and data from training. It is scored from 0-100 with each 25 point level going from Low, Medium, High and Very High Energy Reserve. It’s a useful feature for anyone as it balances both training stress along with total stress and rest.
For a professional rider, they may have a high body battery after a 6 hour ride as they can rest the entire day and not worry about going into work. For someone working 9-5, doing an intense one hour interval session in the evening may leave you quite fatigued.
Understanding when your Body Battery is low can help you make informed decisions about training - rather than doing too much with not enough rest, and becoming ill or slipping into overtraining.
Sleep
We know that to improve in our performance we need to train, as training stress is the stimulus for our body to adapt via training adaptations. However, these adaptations only occur when the proper amount of rest is achieved - and sleep plays a huge part of that rest equation.
The duration of sleep required will vary from person to person, as well as being dependent on the level of training or life stress that you’ve encountered. It can also change seasonally. However, Garmin recommends a blanket 7.5 to eight hours of sleep a night. I listened to Garmin’s sleep recommendation and tracked my cycling performance - here I covered the difference that I found it really made.
Tracking your sleep - and ensuring that you try and stick to a sleep schedule - are great ways to try and help ensure you get the right amount of sleep. The Garmin Fenix has a nice feature in that when you set a sleep time, it will mute notifications in the lead up so that you spend less time looking at your phone and being exposed to blue light - which can impair sleep.
Sleep score
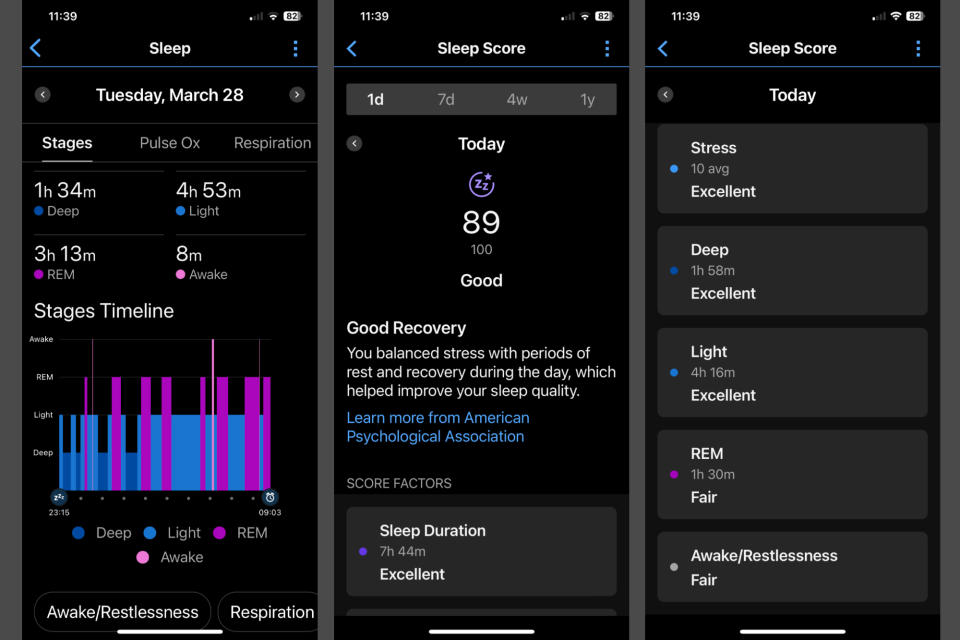
Moving on from total sleep, we have the ‘Sleep score’. Not all sleep is created equal - there is deep sleep, light sleep, rapid eye movement (REM), time awake, and disrupted sleep. Using the Garmin Fenix overnight, you can see how you sleep, as well as an overall sleep score.
This sleep score is based on a combination of total time asleep, stress experienced during sleep, the amount of time spent in the different types of sleep, and amount of time awake or restless. This is useful as you can then see patterns which might be affecting your sleep score, allowing you to address them and hopefully improve the quality of your sleep and rest. When it comes to sleep, it’s quantity and quality combined which makes the difference.
VO2max/Training Status
Garmin watches can give you an idea of your overall ‘Training Status’, using a combination of your VO2max, HRV and the training that you perform. The VO2max estimate is determined by tracking your heart rate and power over a few minutes of moderate intensity cycling and results in a score which is graded from poor up to superior, and corrected for heat and elevation.
In the Training Status summary, it will state if your VO2max is declining, increasing, or remaining static. Naturally, we want it to be increasing. HRV is then measured to see whether it is remaining at optimal levels, increasing, or decreasing, whilst the Acute Training Load (ATL) tracks the stress of recent training sessions based on volume and intensity.
If the ATL is correct and your VO2max is increasing, as well as your HRV being within the right levels, you will get a Training Status of ‘Productive’. If your VO2max is going down, ATL is below or above optimum, and your HRV is not within the correct range, then you will get one of these descriptions:
Detraining (not training enough)
Recovery (lower training stress but needed to recover from tough block)
Maintaining (enough stress to maintain fitness but not improving)
Productive (progressing and improving, remember to include recovery rides)
Peaking (reduced training load after a training block, form will be high)
Overreaching (training too much and need to rest)
Unproductive (good training load but fitness is decreasing, focus on rest and nutrition)
Strained (more recovery, less training load. Normal after a tough event or session)
You can use the Training Status feature to guide your training programming and ensure that you are training enough, resting enough, and peaking for key events and/or your cycling goals.
Training readiness
Moving on from Training Status is ‘Training Readiness’. It can be tempting if we see that our Training Status is that we are detraining, to then increase our training intensity and volume to try and make up for this loss of fitness. However, the reason for our detraining may be because we are experiencing higher levels of stress and lower levels of recovery. This is where Training Readiness comes in.
Through a combination of sleep tracking data, your HRV and your previous training load, Garmin determines if you are in the right state to execute conduct training which will boost your Training Status.
The categories it will place you into consist of: Poor, Low, Moderate, High or Prime. If you have slept well, have a good HRV level, have low stress and if your training load has not been extreme, then you will likely have a ‘Prime’ readiness. If you have slept badly, your HRV is out of the proper range, your stress is high, or if your training load has been unusually heavy, you will likely have a lower level of readiness.
Menstrual cycle tracking
Particularly useful for female athletes is the menstrual cycle tracking. There has been a myriad of recent studies into the effects of different phases and subphases of the menstrual cycle, and its effects on training and nutrition requirements.
Although many of these studies found no scientifically statistical differences between phases within the participants, this was often down to a large variation between individuals. What we can infer from this is that each person’s menstrual cycle will affect them differently - which is why tracking it becomes so important.
For example, if you know that during the ovulatory phase you get cramps and don’t feel as your strongest, you might find it best to adjust the recovery phase of your training plan to specifically overlap with this time period. On the other hand, if you tend to feel particularly strong during the early follicular phase, you know that this is a point to stack up some of your hardest workouts.
Tracking your cycle can also help you see if there have been any changes, such as variations which can indicate issues such as Relative Energy Deficiency in Sports (RED-S) - flagging that you need to fuel and rest more than currently.
Here you can find out more about how to adjust your fuelling at each stage of the menstrual cycle.

