Boston Versus New York City: Which Marathon Is Harder?
This article originally appeared on Outside
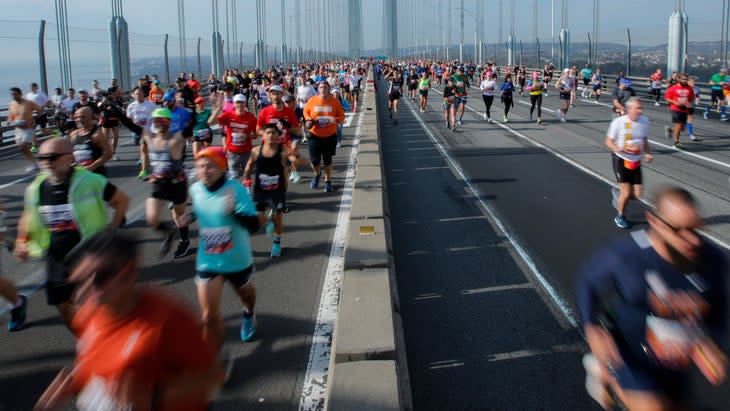
While marathons like Chicago and Berlin are known for their fast and flat courses, marathon majors like the New York City and Boston Marathons are known for their demanding climbs, descends, and deafening cheer sections. We looked at thousands of data points provided by Strava to understand better how runners fare in the Boston and NYC marathons.
A Note On Courses, Weather, and Methods
Each course is unique and has different participant density, while the logistics of the race themselves vary, too. Those variables should be taken into account when looking at why runners perform differently at each event. Boston also has a qualifying standard, too, which means that most of the field has run a marathon previously and is self-selected for faster finishes.
We've removed the data from NYC 2022 because the historically hot temps were a bigger factor in finishing times than the course itself. That said, both marathons are susceptible to swingy weather. For the three years we analyzed, Boston had starting temperatures at 60, 46, and 48 degrees Fahrenheit, with 88 to 99 percent humidity, while NYC had temperatures ranging from 44 to 71 degrees Fahrenheit (excluded year) and 50 degrees Fahrenheit with 71 percent and 64 percent humidity.
Most of our analysis compares runners in a certain pace group (for example, runners targeting a sub-four-hour finish). Simply comparing results across both races would skew the analysis because of their varied pace distributions (in no small part because of Boston's stringent qualifying requirements for most participants). Both races are fairly similar in gender composition. This year, 55 percent of NYC competitors identified as male, as well as 57 percent of Boston runners.
Performance Indicators Across Marathons
A major indicator of marathon performance is a negative split, or running the second half faster than the first. It's a prudent racing strategy but tough to implement on race day, especially on hilly courses like NYC or Boston.
In the faster pacing groups, more runners at Boston managed to successfully negative split (again, likely due to previous race experience, as evidenced in this previous analysis of Boston Strava data). Runners aiming for a 2:30 to 3:00 finish were 38 percent more likely to negative split Boston (11 percent versus just 8 percent of the same pace cohort at NYC). Runners shooting for a 3:00 to 3:30 finish were 19 percent more likely to negative split at Boston than NYC, but for runners targeting just under four hours, there was a similar likelihood of a negative split. Interestingly, for runners aiming for a finish over four hours, Boston runners were less likely to negative split. While Boston is a net downhill course, those Newton hills can really chew up quads!
RELATED: Looking to Qualify for the Boston Marathon? Here's What Strava Data Says About That Elusive BQ.
Now, let's look at how many runners at each race met their goals. To do this, we compared runners' average pace in the first eight miles and their projected finish times. We instituted a strict threshold and didn't count times even a second over their goal finish time. Using this analysis, runners are significantly more likely to hit their goals at Boston. Again, this is likely because qualified runners have more marathons under their belt, and experience is invaluable in pacing and race-day execution.
But executing an ideal marathon is easier said than done, regardless of the course. Less than 10 percent of runners nailed their exact goal in either field, regardless of race or pace group. The biggest difference between races was in the 3:00 to 3:30 pace group, with a 67 percent difference between Boston and NYC runners in that particular pace group hitting their goal. In pace groups for four hours or longer, there was a fairly negligible difference between pace groups.
What About The Bonk?
While it’s fascinating to determine what makes for a successful marathon experience, we'd be remiss if we didn't use our fine-tooth data comb to parse the fascinating data around what makes a bad day at a marathon.
"Bonking" or "hitting the wall" happens when the body has depleted its glycogen stores and starts to fatigue and burn fat, causing the legs to slow and energy to plummet. Legs feel heavy, exhaustion can feel overwhelming, and taking a quick asphalt nap can be tempting. This tends to happen around miles 16 to 20 and is many marathoners' worst nightmare.
RELATED: Why Do I Bonk When It Gets Hot?
We looked at the difference in runners' average pace for the last 10K versus the first 20 miles to see how many people bonk. A 10 percent slowdown is an off-day, not totally outside of the realm of possibility for many runners. It isn't out of line with fairly normal marathon fatigue (or a quad-explosion in the Newton Hills). But a 20 percent slowdown is a true bonk, a pretty bad day. For athletes targeting a sub-4:00 finish, a ten percent slowdown would look like going from 9:09 miles to 10:04. A 20 percent slowdown would go from 9:09 to 10:59.
Here's where things get fun. There's significantly more variation between years for Boston, with 2023 being a more consistent year with fewer bonks in the field. The footprint of the 2022 NYC Marathon is also clear here, with the majority (71 percent) of the field (speedsters included!) slowing down significantly in the heat and humidity. The groups with the biggest bonks were the folks shooting for four hours or longer at Boston (more time on feet can increase the potential for a bonk, especially if there's significant time between aid stations).
Bonking is still significantly more likely at the NYC marathon across all pace groups and years. For instance, for athletes targeting a 2.5- to 3-hour finish, runners are 33 percent more likely to experience a moderate bonk (slowing down 10 percent or more) at NYC, and 55 percent more likely to experience a severe bonk (or 20 percent or more slowdown), at NYC (accounting for 20 percent of this group at NYC, versus 13 percent at Boston).
Hills Versus Bridges
Boston is known for its hills, both Newton and Heartbreak. New York has bridges and boroughs. But which causes runners to slow down the most?
To do this, we looked at the first eight miles to establish a "goal pace" for athletes targeting a sub-four-hour finish and saw that both races are pretty evenly split across the halfway mark.
About a third of athletes start to slow down at the halfway mark, but not by too much. At NYC, things get tricky in miles 15 to 16, with almost all athletes slowing by 5 percent as they tackle the Queensboro Bridge. (79 percent of runners slowed down here, and to the 21 percent that didn't, please DM us your strength routine.)
There's another crux at mile 24 of the NYC marathon, with a mile-long climb into Central Park. We see 85 percent of runners miss their goal pace here, with runners averaging a 20 percent slowdown (for four-hour marathoners, going from 9:09 to 10:59 pace).
Boston has its infamous Heartbreak Hill, which causes the biggest slowdown of that race. Eighty-one percent of runners slow as they hit the 20th mile, and 90 percent slowing in the 21st mile. So, while the hills of Boston are undoubtedly hard and have earned their reputation, maybe it's time we pay the bridges the respect and attention they deserve, too!
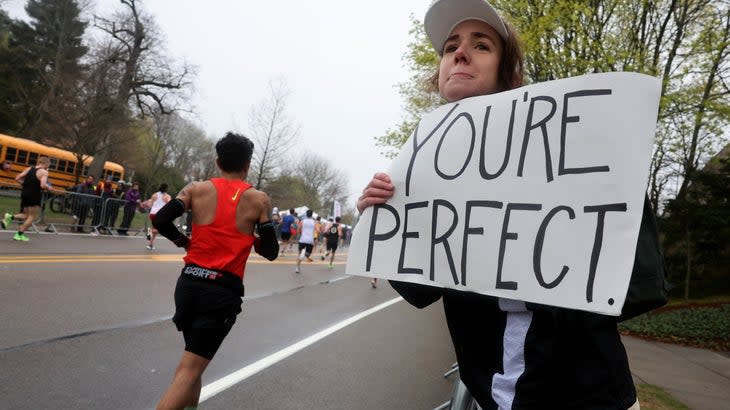
Regardless of the course, running a marathon is a major accomplishment, and to all the competitors who toed the line, we say hats off to you and your majorly impressive data!
For exclusive access to all of our fitness, gear, adventure, and travel stories, plus discounts on trips, events, and gear, sign up for Outside+ today.

