Disney Tops Nielsen’s New Cross-Platform Ratings Tool With 11.5% of Total TV Viewership
Nielsen has launched a new tool to better monitor the ongoing streaming wars. Say hello to the Media Distributor Gauge, which will break down total cross-platform viewership across media companies.
The Media Distributor Gauge is a spin-off of sorts from Nielsen’s monthly The Gauge report. But whereas The Gauge breaks down total streaming by platform, the Media Distributor Gauge breaks things down based on each media company.
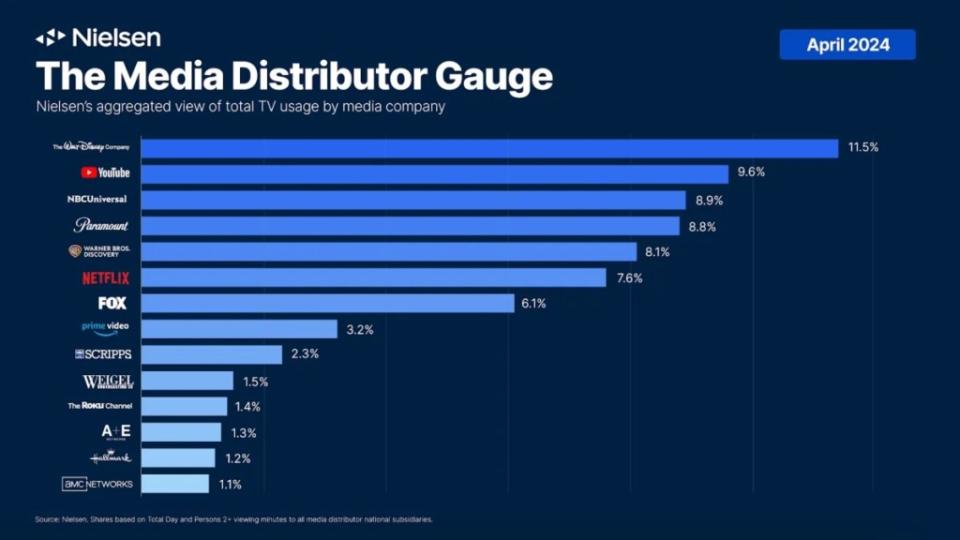
For example, according to the Media Distributor Gauge, The Walt Disney Company was most-watched in April, claiming 11.5% of total TV viewing time across Disney+, Hulu and ABC. However, the most-watched individual platform for April was YouTube, which secured 9.6% of total viewing.
Though YouTube saw a 3% monthly decline in viewing compared to March, April marks its 15th consecutive month as the top streaming platform.
“The objective of the original was to illustrate how viewing trended across broadcast, cable and streaming and also to track the growth and emergence of streaming platforms along the way,” Brian Fuhrer, SVP of product strategy and thought leadership for Nielsen, explained in a Tuesday video. “But beginning this month, The Gauge will add data on audience engagement by media distributor.”
The Media Distributor Gauge will provide an “aggregated perspective by media company.” The data was determined by taking the total minutes viewed by each media distributor divided by total usage. The minimum reporting threshold for this new metric is 1.0% share of TV, which 14 companies cleared.
“With more programs available across platforms, it’s vital for creators, advertisers and the industry at large to understand what and where audiences are watching,” Karthik Rao, CEO of Nielsen, said in a statement. “The Media Distributor Gauge is a perfect complement to the The Gauge and serves as the first convergent TV comparison of its kind. Together, these reports paint the most complete picture of TV viewing today, which is critical as we head into the upfront.”
On a broader level, The Walt Disney Company was the top performer in April. Roughly 42% of its total TV viewing share was attributable to users on Disney+ and Hulu.
In fact, Disney has been the top performer since November 2023, according to Nielsen data. Its share was the biggest this past December and January, two months that saw the company secure 11.8% of overall TV viewership. Its least-watched month was February (10.4%), though it still remained the top performing company based on the Media Distributor Gauge.
Disney was followed in second place by YouTube and its 9.6%; NBCUniversal came in third (8.9%); Paramount came in fourth (8.8%); Warner Bros. Discovery came in fifth (8.1%); and Netflix came in sixth (7.6%). However, Netflix ranked as the second-highest solo streaming distributor behind YouTube.
Other media companies that made the April list were Fox, Amazon Prime Video, Scripps Network, Weigel Broadcasting Co., The Roku Channel, A+E Networks, Hallmark and AMC Networks.
The month of April also saw record-breaking viewership for the NCAA and Amazon Prime Video. Women’s basketball tournament coverage brought in strong number across broadcast and cable, as did Prime Video’s hit video game adaptation, “Fallout.” The series currently ranks as Amazon’s most successful program to date.
Yet overall, TV viewing saw a small decline for the month, an expectation given the season. Time spent watching TV was fairly flat both month-to-month (down 2%) and year-over-year (down 0.6%).
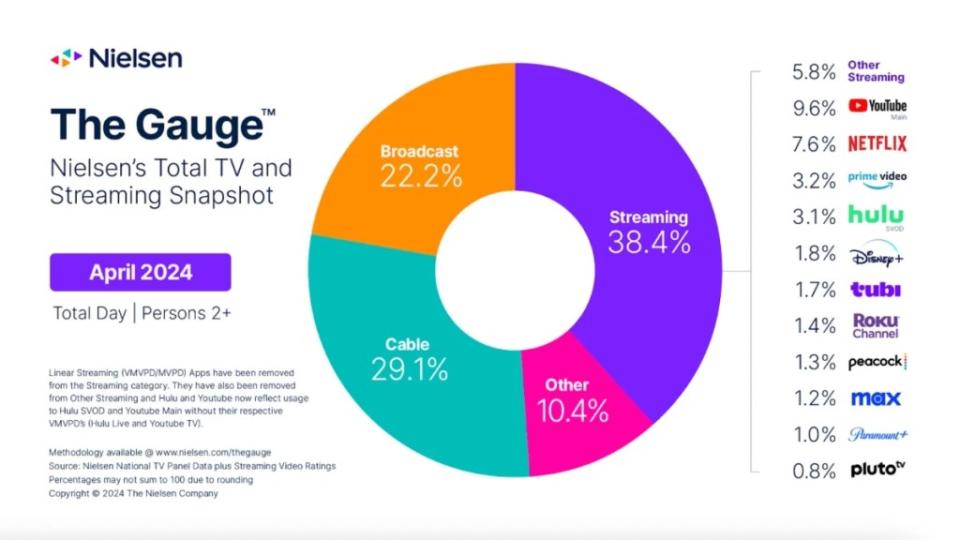
In fact, both broadcast and streaming saw a decline in April as compared to March. Broadcast’s monthly decline was 3%, which equated to a 22.2% overall share of television. This was boosted by the 17.6 million viewers on ABC for the NCAA women’s tournament as well as the viewerships of “Tracker,” “NCIS” and “Young Sheldon” on CBS, as well as “Chicago Fire” and “Chicago Med” on NBC.
Streaming’s monthly decline was 1.9%, resulting in the category losing a 0.1 share point and accounting for 38.4% of total television viewed. Out of the streamers, Amazon Prime Video saw the largest increase with a 12% monthly increase for 3.2% of total TV. This was largely due to the success of “Fallout,” which topped all streaming titles this month with over 7 billion viewing minutes.
The only category that didn’t see a decline in April was cable, which secured its second consecutive monthly increase in the share. In March, it accounted for 28.3% of TV, and in April that moved to 29.1%. This was largely due to a 28% increase in cable sports viewing thanks to NCAA basketball tournament coverage, NBA playoffs and the NFL draft. Four of the Top 6 cable telecasts in April were also occupied by the women’s NCAA basketball finals and semifinals coverage.
While cable may have had a good April compared to March, it saw a year-over-year decline of 8.2%. Its share also lost 2.4 points.
The post Disney Tops Nielsen’s New Cross-Platform Ratings Tool With 11.5% of Total TV Viewership appeared first on TheWrap.

