
 generic
 Where the S&P Goes from Here
Despite last week’s rally, we’re in a clear downtrend … how low might the S&P fall? … looking at bullish estimates … a huge data dump next month can give direction
If we look over the last five trading sessions coming into today, the S&P 500 climbed nearly 7%.
So, we’ll ask the same question we’ve been asking for months now…
Are we seeing the beginnings of a real bullish reversal, or is the recent strength just another dead cat bounce within a bearish decline?
InvestorPlace - Stock Market News, Stock Advice & Trading Tips
Well, below is the chart of the S&P 500 over the last year. I’ve added a crude trendline starting from the December low that catches the majority of the lows here in 2022.
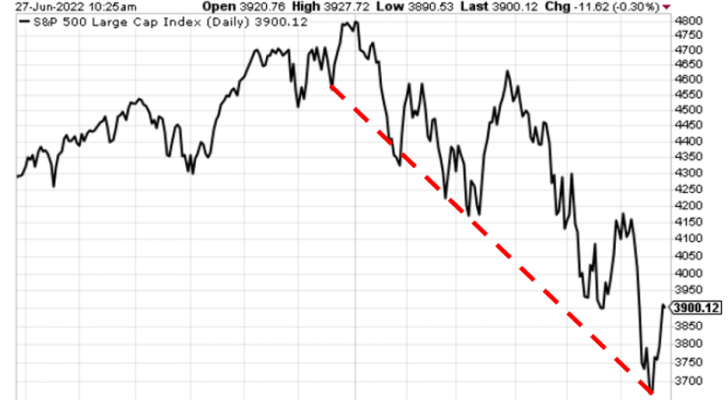
Source: StockCharts.com
From this perspective, the answer seems obvious…
The S&P is riding its bearish trendline lower. Any market bounce we see is just bullish smoke and mirrors amidst a broader, consistent decline.
But no bear lasts forever. And much froth has been drained from the market in recent months.
So, where is the market going as we approach the back half of the year?
Let’s answer this by looking at a few potential paths for the S&P.
We’ll use some 6th grade math to help us. If you’re not a math person, don’t worry, I’ll clarify the takeaways.
***One of the most widely used stock-market valuation metrics is the price-to-earnings ratio (P/E)
It’s likely you’re very familiar with this ratio, but let’s make sure we’re all on the same page.
Here’s the P/E ratio visually.
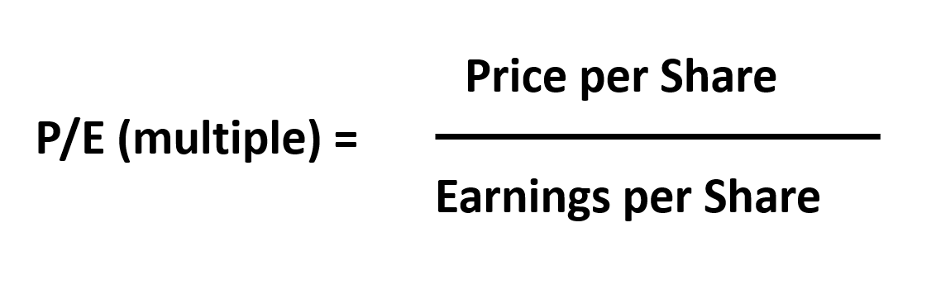
With a traditional P/E ratio, investors take a stock’s current price, then divide it by its earnings. That gives us the P/E multiple (in today’s case, we’re performing this calculation for an index).
Investors then compare this multiple to its long-term average P/E multiple. This comparison reveals whether the stock or index is under- or over-valued relative to history.
To illustrate, the long-term average P/E ratio for the S&P 500 is 16 (15.97, to be exact). Meanwhile, as I write Monday, the S&P’s P/E ratio is at 19.8.
Translation – despite the pain all year long, the S&P is still overvalued relative to its historical average of 16.
***The problem is this backward-looking P/E ratio is of limited value because it uses old earnings data
In other words, the P/E ratio tells us if the market was under- or overvalued.
But Wall Street is forward-looking. We want to know what’s coming because that’s what’s going to drive prices tomorrow.
Enter the “forward” P/E ratio.
It’s the same calculation, but we use analysts’ guesses at what earnings will be in the coming 12 months.
Now, we don’t have to look a full 12 months out. For example, we can estimate earnings for 2022, giving us a sense for where the market will finish the year.
So, let’s answer our question of “where’s the market going?” by focusing on this end of year timeframe. After all, estimating six months out is easier than 12 months.
Estimates for the S&P’s 2022 operating earnings vary, but Ed Yardeni (who happens to be Louis Navellier’s favorite economist) reports that the consensus estimate is $229.57. Yardeni puts his own estimate at $225.
Let’s split the middle-ish and say $227.
Using this estimate, let’s walk through a few hypotheticals about where the S&P could go.
***Some back-of-the-napkin estimates for the S&P
Since we’re solving for the S&P’s market value, our variables are our S&P earnings estimate and the P/E multiple that investors will be willing to pay for earnings – in other words, sentiment.
So, hypothetical #1…
Let’s assume that earnings come in at our estimate of $227. And let’s say that the price-to-earnings ratio continues falling as it has all year, as you can see below.
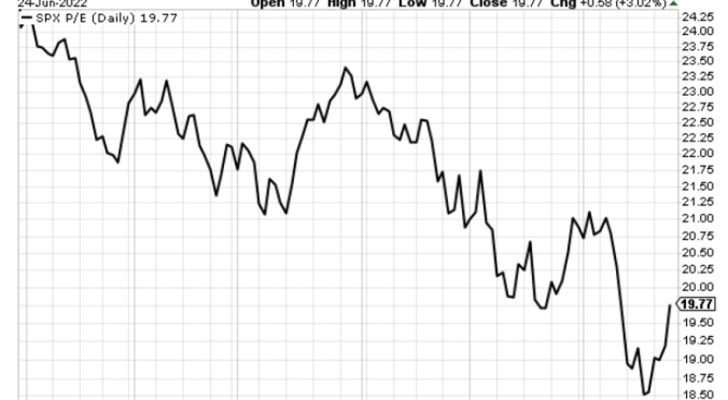
Source: StockCharts.com
Specifically, let’s say that investor sentiment returns to its long-term average of 16. As noted a moment ago, the S&P’s current P/E ratio is 19.8.
So, what would this mean for the S&P’s level?
To find out, we multiply our assumed P/E multiple of 16 times the 2022 earnings per share estimate of $227 to get 3,632.
With the S&P trading at 3,904 as I write, that means a decline to 3,632 would see the S&P drop another 7%.
Now, you might think “that estimate of a 16-multiple is too low. The S&P hasn’t traded there for years.”
That’s true. But that doesn’t mean it can’t happen.
Math doesn’t lie, and the averages are what they are.
For example, back in 2011, the S&P’s P/E fell below 12.75.
And as you can see below, it spent roughly one and a half years trading between 13 and 16.75.
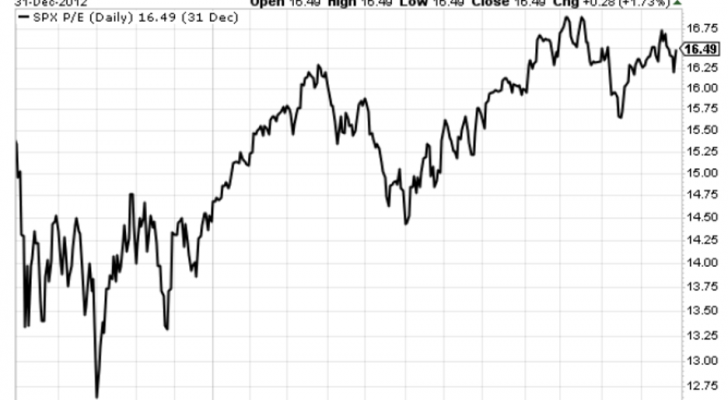
Source: StockCharts.com
But…
***One argument you’ll hear from some investors is that long-term averages for P/E ratios are outdated
They have a point.
Mark Hulbert analyzed P/E ratios dating back more than 100 years. He found that the average P/E leading up to 1930 was 13.6.
From 1931 to 1965, it was 13.9.
From 1965 through 2000, it was 15.6.
But then, from 2000 through the latest update of Hulbert’s article a little over a year ago, the average P/E came in at a whopping 25.7!
So, in this recent, new world of higher valuations, how low do P/E’s tend to drop in recessions?
(It’s debatable whether we have really moved into such a “new world of higher valuations” but that’s outside the scope of today’s Digest. Let’s just go with it for now.)
From DataTrekResearch, looking at recessions since 2000:
…Where the S&P 500 index has bottomed on a trough PE basis around prior recessions…
October 2002: 20.0x (note: based on Q4 2001 earnings, that cycle’s trough)
March 2009: 17.1x
March 2020: 18.3x
The average of the last 3 observations is 18.5x.
Using this recent average as our guide, in this hypothetical, let’s assume the P/E only falls to 18.5.
But…
Let’s say that earnings come in lower than expected.
Now, is there a case for this?
Absolutely. Analyst estimates can be woefully wrong.
Investopedia reports that, on average, forward earnings estimates are about 10% higher than where earnings actually come in.
Some studies put the number far higher.
For example, a paper written in 2016 called An Empirical Study of Financial Analysts Earnings Forecast Accuracy put the overestimation at 25%.
Because we’re already halfway done with the year, let’s pick a middle-ish number and assume that earnings are 15% too high.
So, rather than hitting $227, they’ll come in at $192.95 ($227 x 0.85).
Where would that put the S&P?
We multiply our P/E ratio multiple of 18.5 times $192.95 to get 3,569.
That’s almost 9% lower than where we are today.
Of course, if earnings disappoint that much, there’s no way the P/E ratio would remain at 18.5. As investors’ moods sour, that would reduce the multiple they’re willing to pay for lower earnings.
Just to give you an example of what that could do to the S&P, imagine earnings are 15% too high and the P/E falls to 16. That would put the S&P at 3,087, or 21% lower.
We won’t even do the math on a situation in which sentiment turns so bearish that the P/E ratio falls to, say, 14. But the obvious takeaway is we’d be in store for deep, double-digit losses.
***Let’s stop being so bearish and consider some happier scenarios
Let’s say the earnings estimate of $227 is accurate.
And let’s imagine investors remain in today’s mood, meaning no significant changes to our current P/E of 19.8.
That puts the S&P at 4,494 by the end of the year, or about 15% higher.
That would certainly be a nice rebound on a brutal year so far.
Now, let’s get super bullish.
Let’s say the Fed’s tightening campaign succeeds.
It slows down the economy just enough to snuff out inflation without causing a recession or significant damage to the labor market. This is the elusive “soft landing.”
How has the stock market responded to such a victory?
Well, if we look back to 1994 as our guide, stocks were negative for the year as the Fed hiked rates seven times over 13 months.
But the following year, the market exploded 34% higher.
Though we shouldn’t look for this to happen by the end of 2022, such bullishness would push the S&P up to 5,231 (from today’s level) – a new all-time-high.
As you can see, we have a wide range of possibilities at this point.
***Now, you might be rolling your eyes, saying, “wow, Jeff, super-helpful. A range of ‘21% lower’ to ‘34% higher’ really narrows it down for me”
I hear you. That’s awfully wide.
Unfortunately, right now, there are simply too many unknowns to provide a more detailed projection.
But here’s the good news…
The coming month is going to provide enough new data to bring a far clearer forecast into view.
Consider what we’ll learn in July…
First, we begin Q2 earnings season around July 15th. These earnings will reflect the slowdown (or lack thereof) in the economy over the last few months. They’ll shed a great deal of light on the accuracy of current estimates.
Plus, CEOs will have enough data to provide far better guidance for the remainder of 2022. They’ll see patterns and trends that were murky a few months ago. Much of the guesswork will have been eliminated.
Second, we get the next CPI print on July 13th. As our hypergrowth expert Luke Lango has said, everything about today’s market and economy hinges on inflation.
If the CPI continues to climb, we’ll need to adjust lower our P/E multiple estimates for the coming months. But if inflation cools, it could be a massive tailwind to sentiment.
Third, the Fed’s next policy meeting concludes on July 27th. We’re going to know whether or not the Fed will carry through with its anticipated 75-basis-point hike. And as importantly, we’ll get commentary from Federal Reserve Chairman Jay Powell, which has moved markets in the past.
Finally, the advance estimate of Q2 GDP comes out on July 28th. Right now, estimates are anticipating 0.0% growth. If it ends up being negative, that means we’re already in a recession – buckle up.
Bottom line, as you can see, there are many factors obscuring the S&P’s path forward right now. So, unless you’re convicted about a specific market move, hang tight until July brings more answers, because lots of them are coming.
By the end of July, many of today’s clouds will have parted, helping us narrow down our range for where the S&P finishes the year.
Have a good evening,
Jeff Remsburg
The post Where the S&P Goes from Here appeared first on InvestorPlace.
