
 generic
 Uber's (NYSE:UBER) Profitability Problem - Why the Company Finds it Hard to Increase its Market Cap
First published on Simply Wall St News
Uber Technologies, Inc. (NYSE:UBER) has been struggling with profitability for some time. It seems that investors are wondering why the market isn't as optimistic on Uber as it was on other tech stocks. For this reason, we will look at when Uber will become profitable, what can we expect in profits, and what is the value of those profits. Hopefully this will help investors better understand the possible reasons for the current stock price.
Quick recap: Uber Technologies, Inc. develops and operates proprietary technology applications in the United States, Canada, Latin America, Europe, the Middle East, Africa, and the Asia Pacific. On 31 December 2021, the US$64b market-cap company posted a loss of US$496m for its most recent financial year.
Check out our latest analysis for Uber Technologies
Estimating The Breakeven Point
According to the 40 industry analysts covering Uber Technologies, the consensus is that breakeven is near. They expect the company to post a final loss in 2022, before turning a profit of US$19m in 2023. The company is therefore projected to breakeven just over a year from now.
How fast will the company have to grow each year in order to reach the breakeven point by 2023?
Working backwards from analyst estimates, it turns out that they expect the company to grow 52% year-on-year, on average, which signals high confidence from analysts.
Should the business grow at a slower rate, it will become profitable at a later date than expected.

Given that Uber has been close to profitability in 2019, it is not a big stretch to assume that the business is vulnerable to external risk factors in consumer spending and behavior.
Uber's Profitability
Uber has a gross profit margin of 35.7%, which changed some -7.3% from three years ago, indicating that the business is still struggling with the cost structure. These results may further shift in the future, if gas prices and other inflation impacted inputs keep rising.
The company's net profit margin is -2.8%. While top line margins are that of a tech company, Uber is having continuous issues with bringing the company on the right side of 0.
A negative margin is not something to be concerned about if the business is expected to grow, otherwise investors are risking buying a stock with an unprofitable business model.
The final line for profitability of a company are the cash flows, which is what investors have a claim on.
While not yet profitable, it is good to see that the cash flows from operations are increasing in Uber. In the chart below, we can see the slow recovery from 2020, as well as some inflows from financing between 2018 and 2020:
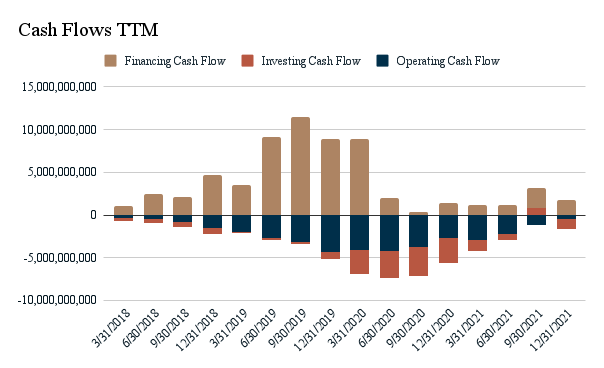
Operating cash flows show how much the company made from operations, after expenses, and are similar to EBITDA. This is a very important metric, as it show the first signs of real profitability.
Valuation
In investing, the end game of every analysis is to determine the value of a company. If you subscribe to the traditional approach, you are inclined to believe that the current value of a company is the sum of all the future cash flows, adjusted for the risk you are taking in an investment.
In investment jargon, this is called the present value of future cash flows.
Analysts are predicting that by the end of 2024, Uber will make a net profit of US$1.567b, and free cash flows of US$3.947b.
This is critical, as investors use free cash flows to determine the value of a company. Using our 10-year valuation model, and basing it on analysts' forecasts, we come up with a fair value for Uber of US$200b, which would make Uber a dominant large cap stock in the transportation business. This assumes that the company makes about US$12b in free cash flows 10 years from now.
For investors that see Uber as having more difficulties with profitability, we can stop at 2025 levels and assume steady free cash flows of US$4b. Note that analysts use more precise numbers, but this is a pedantic illusion, as they realistically cannot predict the free cash flows with that level of detail.
This lets us calculate the terminal value as: FCF * (1+g)/(Discount rate-g)
4 * (1+ 0.0215) / (0.065 - 0.0215) = $94b
Today, that would reflect a value of Terminal Value ÷ (1 + r)^4
94 / (1 + 0.065)^4 = $73b
Converting to price per share, we get US$37 per share
This seems to closely reflect the current market value per share. Possibly meaning that investors are not so optimistic on a high growth story for Uber and would rather see results before raising their valuation estimates.
Key Takeaways
In our analysis, we estimated that Uber will break into profitability around 2024, and used analyst's estimates from 2025 to calculate both a high growth and a steady growth value.
There is no doubt that Uber has breakthrough technology used by millions of people. However, it seems that employees, consumers and competitors are capturing most of the value, and the company is left with striving for slim cash flows.
This may change in the future, and the company can surge in value creating growth, however currently markets seem to be more cautious at where they invest.
This article is not intended to be a comprehensive analysis on Uber Technologies, so if you are interested in understanding the company at a deeper level, take a look at Uber Technologies' company page on Simply Wall St. We've also put together a list of essential aspects you should look at:
Management Team: An experienced management team on the helm increases our confidence in the business – take a look at who sits on Uber Technologies’s board and the CEO’s background.
Other High-Performing Stocks: Are there other stocks that provide better prospects with proven track records? Explore our free list of these great stocks here.
Have feedback on this article? Concerned about the content? Get in touch with us directly. Alternatively, email editorial-team@simplywallst.com
Simply Wall St analyst Goran Damchevski and Simply Wall St have no position in any of the companies mentioned. This article is general in nature. We provide commentary based on historical data and analyst forecasts only using an unbiased methodology and our articles are not intended to be financial advice. It does not constitute a recommendation to buy or sell any stock and does not take account of your objectives, or your financial situation. We aim to bring you long-term focused analysis driven by fundamental data. Note that our analysis may not factor in the latest price-sensitive company announcements or qualitative material.
