
 generic
 Bitcoin Visits sub-$38,000 as Correlation with the NASDAQ Strengthens
Key Insights:
On Tuesday, Bitcoin (BTC) fell for the fifth time in seven sessions.
Risk aversion from the US equity markets hit the crypto market, with the broader market seeing heavy losses.
Bitcoin’s technical indicators continue to flash red, with Bitcoin sitting well below the 50-day EMA.
On Tuesday, Bitcoin (BTC) slid by 5.74%. Reversing a 2.46% gain from Monday, Bitcoin ended the day at $38,117.
A bearish session saw Bitcoin visit sub-$38,000, with a day low of $37,727. It was Bitcoin’s first fall to sub-$38,000 since March 14, 2022.
Bearish sentiment from the US equity markets spilled over the crypto market, with the crypto majors tracking the NASDAQ.
LUNA tumbled by 8.76%, with ADA and XRP sliding by 7.92% and 7.49%, respectively.
AVAX (-5.77%), BNB (-4.53%), ETH (-6.59%), and SOL (-5.22%) weren’t far behind.
The sell-off saw DOGE fall back out of the top 10 with a 12.90% loss.
Bitcoin Fear & Greed Index Hits Reverse
This morning, the Fear & Greed Index stood at 21/100. Despite Bitcoin’s brief return to $42,900 last week, the Index has continued to sit in the “Extreme Fear” zone
The Index has remained within the “Extreme Fear” and “Fear” zones since April 07.
The “Fear” and “Extreme Fear” zones reflect investor expectations of further price deterioration.
For the Bitcoin bulls, the Index will need to move back through to 46/100 to bring April’s high of $47,433 into play. At present, the Index reflects crypto investor sentiment.

Bitcoin Correlation with the NASDAQ 100 Strengthens
For the US equity markets, it was a particularly bearish Tuesday session. The NASDAQ 100 tumbled by 3.95%, with the Dow and the S&P500 seeing losses of 2.38% and 2.81%, respectively.
For crypto investors looking to break away from Fed policy influence and traditional market forces, the correlation between Bitcoin and the NASDAQ has strengthened.
Crypto investor sentiment towards Fed monetary policy and fears of a recession has realigned with that of more traditional asset class investors.
The correlation between Bitcoin and the NASDAQ strengthened from February to April. The closer correlation coincided with the start of the war in Ukraine and a marked shift in Fed monetary policy.

At the time of writing, the NASDAQ 100 mini was down 16 points, while the Dow mini was up 106 points.
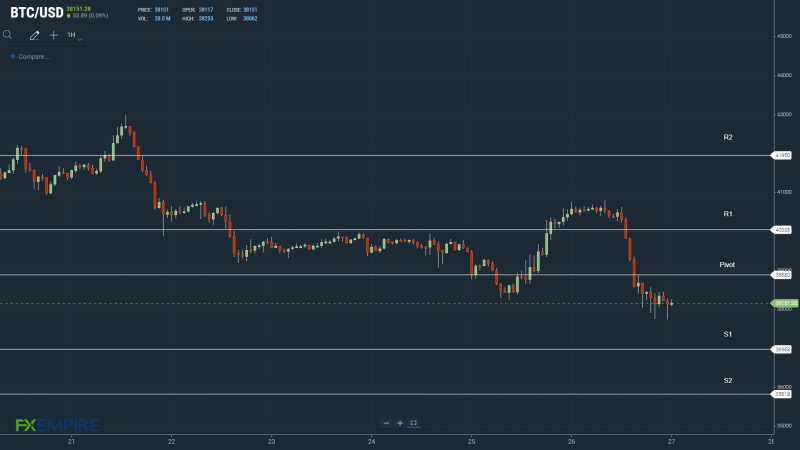
Bitcoin Price Action
At the time of writing, Bitcoin was up by 0.01% to $38,121.

Technical Indicators
Bitcoin will need to move through the day’s $38,880 pivot to target the First Major Resistance Level at $40,038. Bitcoin would need broader market support to break out from $39,500.
In the event of an extended rally, Bitcoin could test the Second Major Resistance Level at $41,950 and resistance at $42,000. The Third Major Resistance Level sits at $45,023.
Failure to move through the pivot would bring the First Major Support Level at $36,968 into play. Barring another extended sell-off, Bitcoin should avoid sub-$36,000. The Second Major Support Level sits at $35,818.
Looking at the EMAs and the 4-hourly candlestick chart (below), it is a bearish signal. Bitcoin sits below the 50-day EMA, currently at $39,943. This morning, we saw the 50-day EMA pull back from the 100-day EMA, delivering downside pressure. The 100-day EMA also pulled back from the 200-day EMA, BTC negative.
A move through the 50-day EMA would support a run at $42,000.

This article was originally posted on FX Empire
More From FXEMPIRE:
Exclusive-Russia sees its oil output falling by up to 17% in 2022 -document
Austria says Russian gas still flowing as it scrambles for alternatives
China Q1 consumption lags in key coastal provinces; Q2 off to weak start
Russia’s GDP decline could hit 12.4% this year, economy ministry document shows
Israeli soldiers kill Palestinian in W. Bank clash, militant group says
