
 generic
 Amazon.com, Inc. (NASDAQ:AMZN) Stock's Been Sliding But Fundamentals Look Decent: Will The Market Correct The Share Price In The Future?
It is hard to get excited after looking at Amazon.com's (NASDAQ:AMZN) recent performance, when its stock has declined 34% over the past three months. However, stock prices are usually driven by a company’s financials over the long term, which in this case look pretty respectable. Specifically, we decided to study Amazon.com's ROE in this article.
Return on equity or ROE is an important factor to be considered by a shareholder because it tells them how effectively their capital is being reinvested. In simpler terms, it measures the profitability of a company in relation to shareholder's equity.
View our latest analysis for Amazon.com
How Is ROE Calculated?
Return on equity can be calculated by using the formula:
Return on Equity = Net Profit (from continuing operations) ÷ Shareholders' Equity
So, based on the above formula, the ROE for Amazon.com is:
8.2% = US$11b ÷ US$137b (Based on the trailing twelve months to September 2022).
The 'return' is the profit over the last twelve months. Another way to think of that is that for every $1 worth of equity, the company was able to earn $0.08 in profit.
What Has ROE Got To Do With Earnings Growth?
So far, we've learned that ROE is a measure of a company's profitability. Based on how much of its profits the company chooses to reinvest or "retain", we are then able to evaluate a company's future ability to generate profits. Assuming all else is equal, companies that have both a higher return on equity and higher profit retention are usually the ones that have a higher growth rate when compared to companies that don't have the same features.
Amazon.com's Earnings Growth And 8.2% ROE
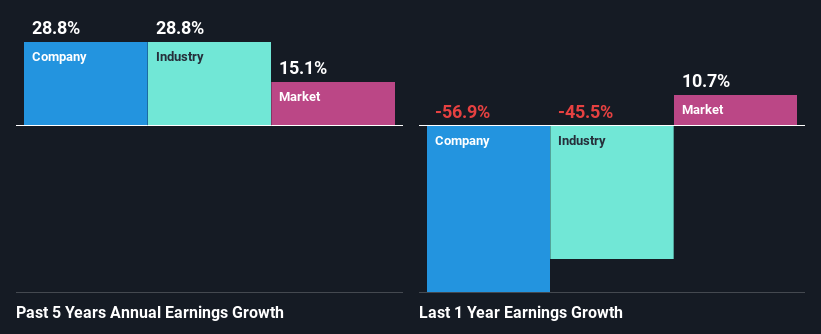
At first glance, Amazon.com's ROE doesn't look very promising. Next, when compared to the average industry ROE of 11%, the company's ROE leaves us feeling even less enthusiastic. Despite this, surprisingly, Amazon.com saw an exceptional 29% net income growth over the past five years. We reckon that there could be other factors at play here. Such as - high earnings retention or an efficient management in place.
As a next step, we compared Amazon.com's net income growth with the industry and found that the company has a similar growth figure when compared with the industry average growth rate of 29% in the same period.
Earnings growth is an important metric to consider when valuing a stock. What investors need to determine next is if the expected earnings growth, or the lack of it, is already built into the share price. Doing so will help them establish if the stock's future looks promising or ominous. If you're wondering about Amazon.com's's valuation, check out this gauge of its price-to-earnings ratio, as compared to its industry.
Is Amazon.com Making Efficient Use Of Its Profits?
Given that Amazon.com doesn't pay any dividend to its shareholders, we infer that the company has been reinvesting all of its profits to grow its business.
Conclusion
In total, it does look like Amazon.com has some positive aspects to its business. Despite its low rate of return, the fact that the company reinvests a very high portion of its profits into its business, no doubt contributed to its high earnings growth. With that said, the latest industry analyst forecasts reveal that the company's earnings are expected to accelerate. Are these analysts expectations based on the broad expectations for the industry, or on the company's fundamentals? Click here to be taken to our analyst's forecasts page for the company.
Have feedback on this article? Concerned about the content? Get in touch with us directly. Alternatively, email editorial-team (at) simplywallst.com.
This article by Simply Wall St is general in nature. We provide commentary based on historical data and analyst forecasts only using an unbiased methodology and our articles are not intended to be financial advice. It does not constitute a recommendation to buy or sell any stock, and does not take account of your objectives, or your financial situation. We aim to bring you long-term focused analysis driven by fundamental data. Note that our analysis may not factor in the latest price-sensitive company announcements or qualitative material. Simply Wall St has no position in any stocks mentioned.
Join A Paid User Research Session
You’ll receive a US$30 Amazon Gift card for 1 hour of your time while helping us build better investing tools for the individual investors like yourself. Sign up here

