New super computer helps artists bring scientists’ work to life at Austin computer lab
AUSTIN (KXAN) — Science isn’t sexy. Most researchers would tell you the same thing. Science is numbers on a spreadsheet, data points, line after line of mind numbing data. Sometimes there is a chart. Sometimes. But not always.
The research scientists at the Texas Advanced Computing Center (TACC), located in north Austin, have the unique responsibility of bringing boring, unattractive data to life.
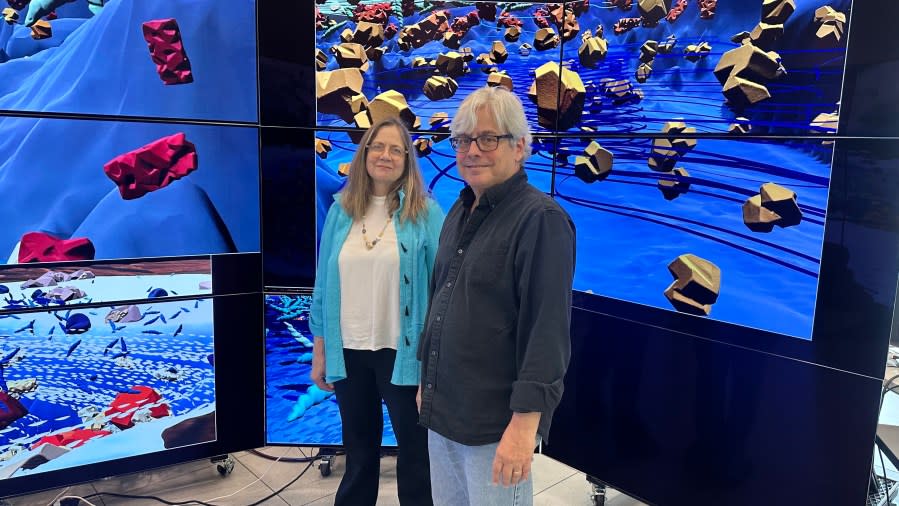
“I use color, shape, form size, to help direct attention where the scientist needs it, but also maintain the complexity that they want to see,” said Francesca Samsel. “I’m probably the only research scientist that has a master’s in fine arts as opposed to a PhD in computer science.”
Francesca got her start in traditional art. Painting “on the sides of buildings” and working “printshops”, before she found her home at the TACC’s Visualization Lab.
Alongside her husband, Greg Abram, Francesca has created visualizations, artistic interpretations of data, for the University of Texas (a second lab is located on campus while the primary is based out of the J.J. Pickle Research Center), Los Alamos Research Labs, and the National Science Foundation.
That last bit is important. This week, TACC unveiled its latest supercomputer, sponsored by the NSF. This supercomputer will allow the team to interpret even more data, generate larger animations and dabble in augmented reality.
Supercomputers and data
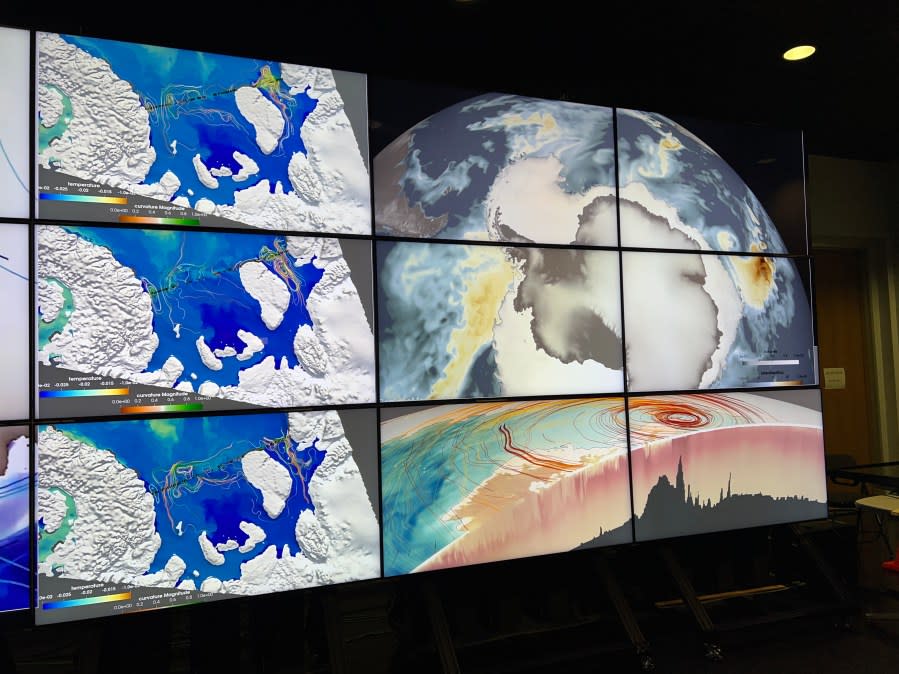
The amount of data we’re talking about is staggering. The team frequently creates visualizations for climate models, for instance. These models can contain a data point for every spot on the surface over the ocean, across a 5km square mile area, all the way to the seafloor. A lot of data.
Extreme weather will be focus on new undergrad program at University of Texas
“That is a breakup of the Earth into billions of individual cells,” Greg said while pointing towards one of the visualizations. “And generating the picture of it means you have to accumulate all those billions of cells into a single image.”
This is where the team’s new supercomputer, named the Stampede3, comes in.
“You use a supercomputer because you have such a vast model that you need to have enormous amounts of memory and enormous amounts of processing power,” Greg said.
Symphonic data displays
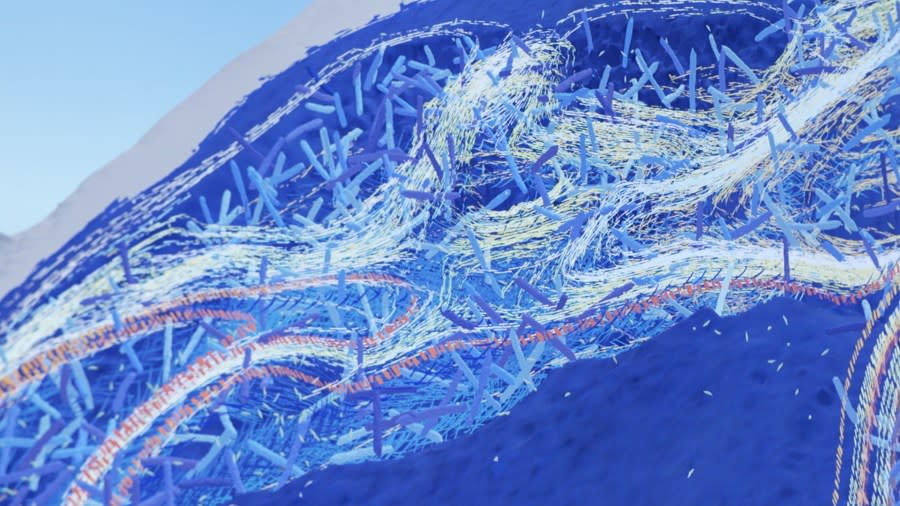
Interpreting this data is just as important as putting it into an animation. Francesca said the first thing she does is ask scientists what is most important with their work. Are they trying to focus on algae data? Wind speed? Warm water? Those points will get greater emphasis.
“I often say it’s like a symphony, you know, and you’ve got a lot of instruments, you’ve got a lot of variables, but you can’t hear them all, if they’re all playing at full volume. So I listen to what the scientists needs to hear, needs to see. And I adjust the volumes of the encodings to suit their needs,” Francesca said.
Could a robot win the World Cup? UT experts explore future of automatons
One animation on display showed plant and animal life living underseas in the Gulf of Mexico. Currents rippled through the map, filled with little shapes. Each of those shapes was actually made by hand and then scanned into the system.
Francesca said this handmade quality provides scientists and the general public an easier pathway to connecting with the information on display.
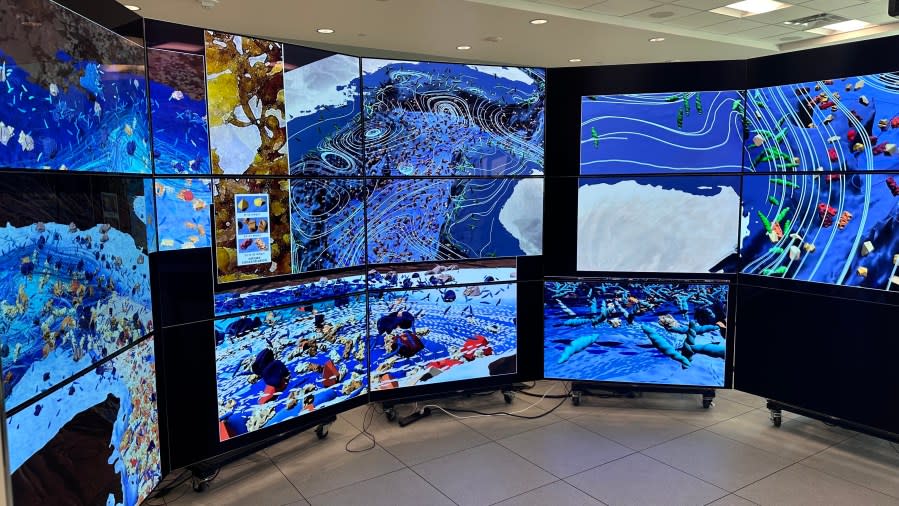
Through a window
Visualizations are not limited to animations in a computer. “When you’re looking at these things on computer screens, you’re looking at data that’s sort of beyond a window,” Greg said.
3D-printed models on one wall help show the undersea floor. Glass on one table is shaped like a glacier in Antarctica, giving a person an idea of not only the shape of a field of study but its very texture.
“It’s like, if you go into a doctor’s office, and they have a model of the heart, it’s like all of a sudden, no, that makes more sense. It’s an entry point,” Francesca said.
One of the latest projects they’re working on is augmented reality. The team showed a 3D-printed model of the land beneath Antarctica. Made of a blue rubber, this model could be laid atop a touchpad.
University of Texas plans to ‘break the universe’ at upcoming event
While a scientist wears special glasses, they can press on different points of the model with their fingers. Suddenly, little animations representing real data of the site would hover over the model.
“Instead of flipping through, like hundreds of images, it enables (the scientists) to come up here and say, ‘Okay, this ridge, I wonder how this ridge is contributing to the ice shelf melt’,” Francesca said.
How visuals help scientists make discoveries
These advances are helping bring science to the masses in unique ways, but also helping provide revelations for scientists.
One example the team showed was of an asteroid impacting the ocean. Researchers wanted to know how big an asteroid needed to be to generate a tsunami. Once all the data was put into the system, they discovered that tsunamis weren’t really a threat.
“What we found when we visualize the pressure in the water was that it canceled each other out, and they didn’t have to worry about tsunamis at all,” Francesca said.
However, the visualization showed water vapor exploding into the atmosphere. A greenhouse gas, water vapor could lead to devastating global warming. This moment became an “oh wow” moment for the scientists.
“It was like, oh, wait a minute, that is water vapor going up into the stratosphere,” Francesca said.
These moments are common. By seeing data, scientists not only get to better understand their discoveries but may make new discoveries themselves.
For the latest news, weather, sports, and streaming video, head to KXAN Austin.

