The Most Segregated Big Cities in America


Racial segregation in U.S. neighborhoods has declined over the past several decades, but it remains very high. Meanwhile, residential segregation by income has risen sharply from the relatively low levels in the 1970s. Large metropolitan areas are among the nation’s most segregated regions.
To identify the most segregated cities in America, 24/7 Wall St. constructed an index (click here for full methodology) based on the share of a metro area’s population living in racially homogeneous zip codes – areas where more than 80% of the population is of a single race or ethnicity. In metro areas with complete integration, every zip code has the same racial/ethnic distribution as the area’s whole population. In areas with the worst segregation, no one lives in a zip code with anyone of a different race/ethnicity.
We reviewed only metropolitan areas with more than 1 million residents. Of those, since racial segregation is only possible in areas with people of various ethnicity, only 29 sufficiently diverse metropolitan areas were considered. Based on our index, more than a third of residents in nine U.S. metro areas live in homogeneous zip codes, segregated from other racial groups.
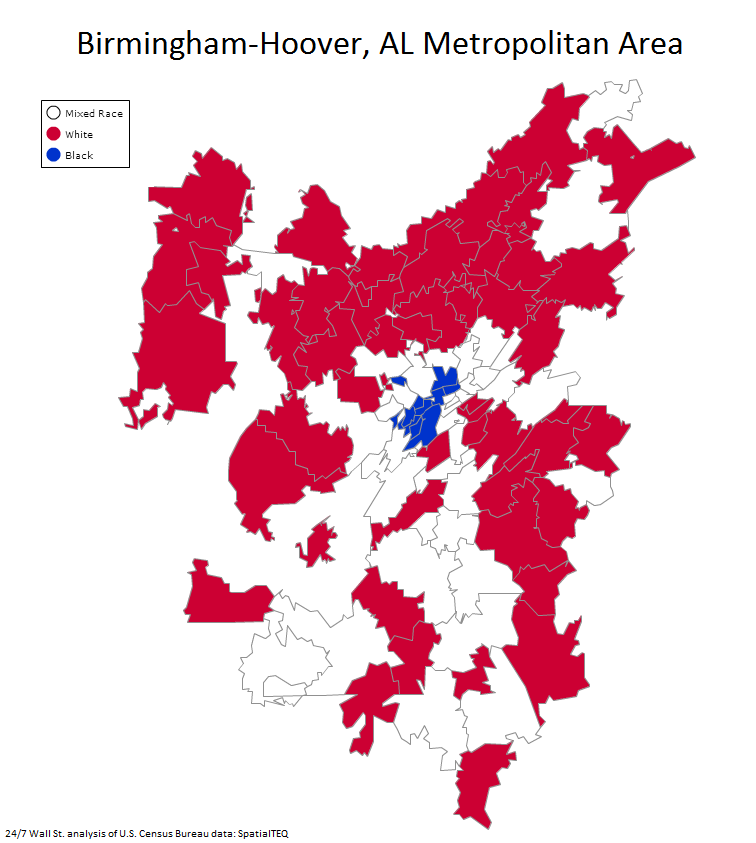
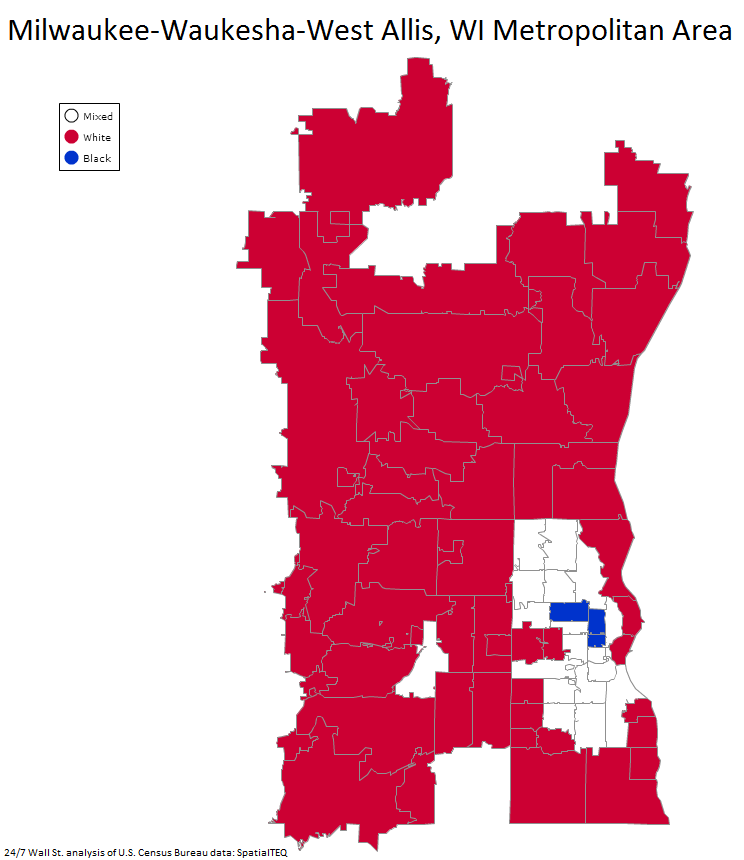
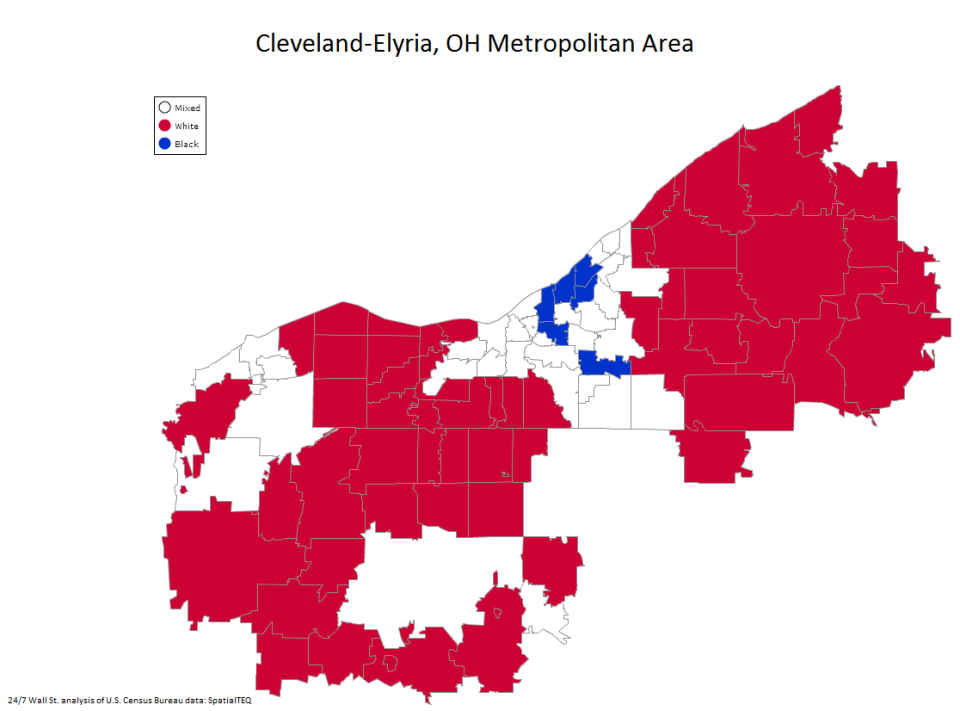
According to Richard Rothstein, research associate at the Economic Policy Institute (EPI), segregation is no accident. Federal housing policies starting in the 1930s are largely to blame for ongoing racial segregation and its economic effects. For example, in the last 60 years, black families were intentionally excluded from affordable housing options across the nation’s growing suburban neighborhoods. As a result, the predominantly black zip codes in America’s most segregated metro areas tend to be located near the city centers, while the predominantly white zip codes are more often found outside the city, in the suburbs.
For black residents, less than 40% of housing units in five of the nine segregated cities were owned by their occupants. In contrast, homeownership rates among whites exceeded 70% in all but one of the nine cities.
Since wealth largely comes from housing investments, and home values have increased dramatically over the decades in many areas, those policies have exacerbated income and wealth disparities, Rothstein explained. Black Americans earn about 60% of what white Americans do, and the accumulated wealth among typical black households is a mere 6% of the typical white household.
Those federal segregation policies, and the resulting economic fallout for black Americans, have contributed to lower educational attainment rates in segregated schools. Commenting on the effects of racial segregation in the school system, Rothstein said, “When you concentrate children with disadvantages in the same classrooms, the whole of instruction becomes remedial and below grade level.”
Racial and socioeconomic segregation are closely linked, especially in large U.S. metropolitan areas. The predominantly nonwhite neighborhoods in all but one of the nine most segregated metro areas have significantly lower educational attainment rates than those of white neighborhoods and the national rates. Segregation along racial lines is also associated with income segregation. The difference between black and white median household incomes exceeded the national gap of $22,681 in all but three of the 29 metro areas reviewed.
Segregation is in many ways a black/white phenomenon, although Hispanics and Latinos also frequently live in segregated neighborhoods. The Boston metro area is the only region considered where segregation impacted the Hispanic population more than blacks. Rothstein said, “For African Americans, it was the product of explicit public policy to segregate them from the rest of society. For Hispanics, it’s the result of traditional patterns of ethnic immigration.”
For Rothstein, racial and socioeconomic segregation must be undone in the same way it was implemented – by a federal desegregation policy. While federal policies make up the bulk of the explanation, the reasons for segregation persisting today are perhaps more complicated. In a recent report from researchers at Stanford University, “Neighborhood Income Composition by Household Race and Income, 1990-2009,” the authors observe that “Other factors, such as differences in household structure, lingering racial discrimination in the housing market, the location of affordable and subsidized housing, and residential preferences, likely also play a role.”
Click through the slideshow to see the most segregated big cities in America.
And click here to see the 10 worst cities for black Americans.
