Y.S.P. Southeast Asia Holding Berhad (KLSE:YSPSAH) shareholders have earned a 32% return over the last year
If you want to compound wealth in the stock market, you can do so by buying an index fund. But one can do better than that by picking better than average stocks (as part of a diversified portfolio). To wit, the Y.S.P. Southeast Asia Holding Berhad (KLSE:YSPSAH) share price is 27% higher than it was a year ago, much better than the market decline of around 3.2% (not including dividends) in the same period. So that should have shareholders smiling. Having said that, the longer term returns aren't so impressive, with stock gaining just 4.7% in three years.
With that in mind, it's worth seeing if the company's underlying fundamentals have been the driver of long term performance, or if there are some discrepancies.
Check out our latest analysis for Y.S.P. Southeast Asia Holding Berhad
In his essay The Superinvestors of Graham-and-Doddsville Warren Buffett described how share prices do not always rationally reflect the value of a business. One flawed but reasonable way to assess how sentiment around a company has changed is to compare the earnings per share (EPS) with the share price.
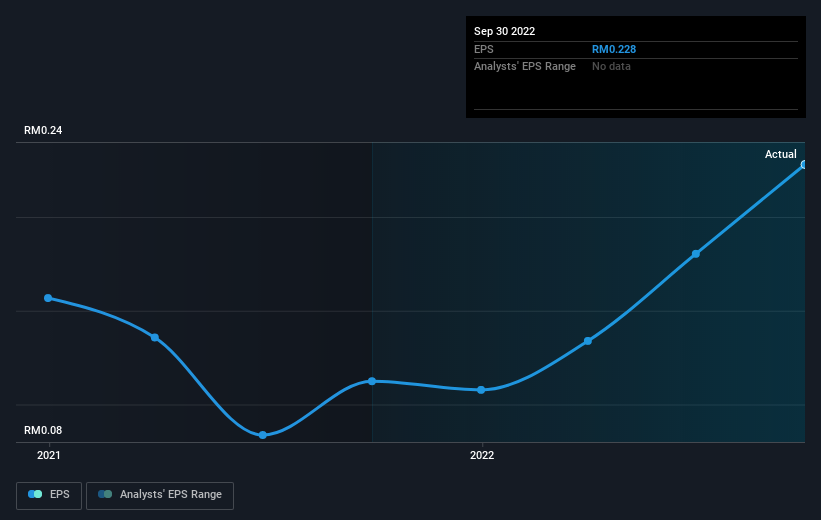
During the last year Y.S.P. Southeast Asia Holding Berhad grew its earnings per share (EPS) by 103%. It's fair to say that the share price gain of 27% did not keep pace with the EPS growth. Therefore, it seems the market isn't as excited about Y.S.P. Southeast Asia Holding Berhad as it was before. This could be an opportunity. The caution is also evident in the lowish P/E ratio of 10.60.
The image below shows how EPS has tracked over time (if you click on the image you can see greater detail).
It's probably worth noting that the CEO is paid less than the median at similar sized companies. But while CEO remuneration is always worth checking, the really important question is whether the company can grow earnings going forward. Before buying or selling a stock, we always recommend a close examination of historic growth trends, available here..
What About Dividends?
When looking at investment returns, it is important to consider the difference between total shareholder return (TSR) and share price return. The TSR incorporates the value of any spin-offs or discounted capital raisings, along with any dividends, based on the assumption that the dividends are reinvested. It's fair to say that the TSR gives a more complete picture for stocks that pay a dividend. As it happens, Y.S.P. Southeast Asia Holding Berhad's TSR for the last 1 year was 32%, which exceeds the share price return mentioned earlier. And there's no prize for guessing that the dividend payments largely explain the divergence!
A Different Perspective
It's good to see that Y.S.P. Southeast Asia Holding Berhad has rewarded shareholders with a total shareholder return of 32% in the last twelve months. Of course, that includes the dividend. Since the one-year TSR is better than the five-year TSR (the latter coming in at 2% per year), it would seem that the stock's performance has improved in recent times. In the best case scenario, this may hint at some real business momentum, implying that now could be a great time to delve deeper. It's always interesting to track share price performance over the longer term. But to understand Y.S.P. Southeast Asia Holding Berhad better, we need to consider many other factors. Consider for instance, the ever-present spectre of investment risk. We've identified 2 warning signs with Y.S.P. Southeast Asia Holding Berhad (at least 1 which shouldn't be ignored) , and understanding them should be part of your investment process.
But note: Y.S.P. Southeast Asia Holding Berhad may not be the best stock to buy. So take a peek at this free list of interesting companies with past earnings growth (and further growth forecast).
Please note, the market returns quoted in this article reflect the market weighted average returns of stocks that currently trade on MY exchanges.
Have feedback on this article? Concerned about the content? Get in touch with us directly. Alternatively, email editorial-team (at) simplywallst.com.
This article by Simply Wall St is general in nature. We provide commentary based on historical data and analyst forecasts only using an unbiased methodology and our articles are not intended to be financial advice. It does not constitute a recommendation to buy or sell any stock, and does not take account of your objectives, or your financial situation. We aim to bring you long-term focused analysis driven by fundamental data. Note that our analysis may not factor in the latest price-sensitive company announcements or qualitative material. Simply Wall St has no position in any stocks mentioned.
Join A Paid User Research Session
You’ll receive a US$30 Amazon Gift card for 1 hour of your time while helping us build better investing tools for the individual investors like yourself. Sign up here
