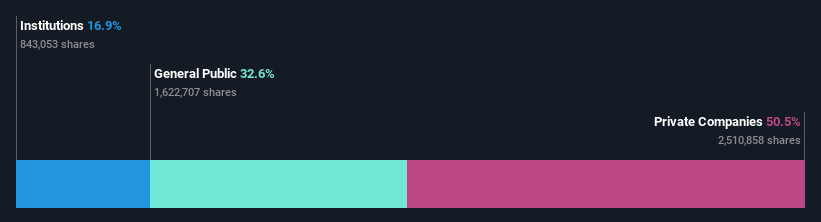
While individual investors own 33% of All for One Group SE (ETR:A1OS), private companies are its largest shareholders with 50% ownership
To get a sense of who is truly in control of All for One Group SE (ETR:A1OS), it is important to understand the ownership structure of the business. We can see that private companies own the lion's share in the company with 50% ownership. That is, the group stands to benefit the most if the stock rises (or lose the most if there is a downturn).
Meanwhile, individual investors make up 33% of the company’s shareholders.
Let's take a closer look to see what the different types of shareholders can tell us about All for One Group.
See our latest analysis for All for One Group
What Does The Institutional Ownership Tell Us About All for One Group?
Institutional investors commonly compare their own returns to the returns of a commonly followed index. So they generally do consider buying larger companies that are included in the relevant benchmark index.
We can see that All for One Group does have institutional investors; and they hold a good portion of the company's stock. This suggests some credibility amongst professional investors. But we can't rely on that fact alone since institutions make bad investments sometimes, just like everyone does. It is not uncommon to see a big share price drop if two large institutional investors try to sell out of a stock at the same time. So it is worth checking the past earnings trajectory of All for One Group, (below). Of course, keep in mind that there are other factors to consider, too.

Hedge funds don't have many shares in All for One Group. The company's largest shareholder is UIAG Informatik-Holding GmbH, with ownership of 50%. With such a huge stake in the ownership, we infer that they have significant control of the future of the company. In comparison, the second and third largest shareholders hold about 8.1% and 2.1% of the stock.
While studying institutional ownership for a company can add value to your research, it is also a good practice to research analyst recommendations to get a deeper understand of a stock's expected performance. While there is some analyst coverage, the company is probably not widely covered. So it could gain more attention, down the track.
Insider Ownership Of All for One Group
The definition of company insiders can be subjective and does vary between jurisdictions. Our data reflects individual insiders, capturing board members at the very least. The company management answer to the board and the latter should represent the interests of shareholders. Notably, sometimes top-level managers are on the board themselves.
Most consider insider ownership a positive because it can indicate the board is well aligned with other shareholders. However, on some occasions too much power is concentrated within this group.
Our data cannot confirm that board members are holding shares personally. It is unusual not to have at least some personal holdings by board members, so our data might be flawed. A good next step would be to check how much the CEO is paid.
General Public Ownership
The general public, who are usually individual investors, hold a 33% stake in All for One Group. While this size of ownership may not be enough to sway a policy decision in their favour, they can still make a collective impact on company policies.
Private Company Ownership
We can see that Private Companies own 50%, of the shares on issue. It's hard to draw any conclusions from this fact alone, so its worth looking into who owns those private companies. Sometimes insiders or other related parties have an interest in shares in a public company through a separate private company.
Next Steps:
I find it very interesting to look at who exactly owns a company. But to truly gain insight, we need to consider other information, too. Case in point: We've spotted 1 warning sign for All for One Group you should be aware of.
Ultimately the future is most important. You can access this free report on analyst forecasts for the company.
NB: Figures in this article are calculated using data from the last twelve months, which refer to the 12-month period ending on the last date of the month the financial statement is dated. This may not be consistent with full year annual report figures.
Have feedback on this article? Concerned about the content? Get in touch with us directly. Alternatively, email editorial-team (at) simplywallst.com.
This article by Simply Wall St is general in nature. We provide commentary based on historical data and analyst forecasts only using an unbiased methodology and our articles are not intended to be financial advice. It does not constitute a recommendation to buy or sell any stock, and does not take account of your objectives, or your financial situation. We aim to bring you long-term focused analysis driven by fundamental data. Note that our analysis may not factor in the latest price-sensitive company announcements or qualitative material. Simply Wall St has no position in any stocks mentioned.
Join A Paid User Research Session
You’ll receive a US$30 Amazon Gift card for 1 hour of your time while helping us build better investing tools for the individual investors like yourself. Sign up here

