Has Wajax Corporation's (TSE:WJX) Impressive Stock Performance Got Anything to Do With Its Fundamentals?
Most readers would already be aware that Wajax's (TSE:WJX) stock increased significantly by 19% over the past three months. Given that stock prices are usually aligned with a company's financial performance in the long-term, we decided to study its financial indicators more closely to see if they had a hand to play in the recent price move. In this article, we decided to focus on Wajax's ROE.
Return on equity or ROE is a key measure used to assess how efficiently a company's management is utilizing the company's capital. In simpler terms, it measures the profitability of a company in relation to shareholder's equity.
View our latest analysis for Wajax
How Do You Calculate Return On Equity?
The formula for return on equity is:
Return on Equity = Net Profit (from continuing operations) ÷ Shareholders' Equity
So, based on the above formula, the ROE for Wajax is:
15% = CA$64m ÷ CA$438m (Based on the trailing twelve months to September 2022).
The 'return' is the income the business earned over the last year. That means that for every CA$1 worth of shareholders' equity, the company generated CA$0.15 in profit.
What Is The Relationship Between ROE And Earnings Growth?
We have already established that ROE serves as an efficient profit-generating gauge for a company's future earnings. We now need to evaluate how much profit the company reinvests or "retains" for future growth which then gives us an idea about the growth potential of the company. Assuming everything else remains unchanged, the higher the ROE and profit retention, the higher the growth rate of a company compared to companies that don't necessarily bear these characteristics.
A Side By Side comparison of Wajax's Earnings Growth And 15% ROE
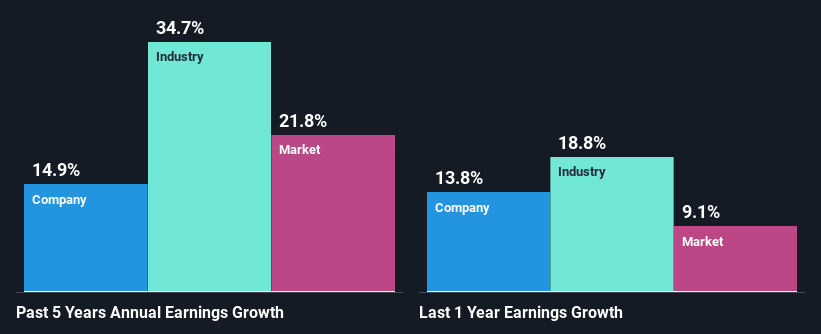
At first glance, Wajax seems to have a decent ROE. Yet, the fact that the company's ROE is lower than the industry average of 21% does temper our expectations. Although, we can see that Wajax saw a modest net income growth of 15% over the past five years. Therefore, the growth in earnings could probably have been caused by other variables. For instance, the company has a low payout ratio or is being managed efficiently. Bear in mind, the company does have a respectable level of ROE. It is just that the industry ROE is higher. So this also provides some context to the earnings growth seen by the company.
We then compared Wajax's net income growth with the industry and found that the company's growth figure is lower than the average industry growth rate of 35% in the same period, which is a bit concerning.
Earnings growth is a huge factor in stock valuation. The investor should try to establish if the expected growth or decline in earnings, whichever the case may be, is priced in. By doing so, they will have an idea if the stock is headed into clear blue waters or if swampy waters await. One good indicator of expected earnings growth is the P/E ratio which determines the price the market is willing to pay for a stock based on its earnings prospects. So, you may want to check if Wajax is trading on a high P/E or a low P/E, relative to its industry.
Is Wajax Efficiently Re-investing Its Profits?
The high three-year median payout ratio of 51% (or a retention ratio of 49%) for Wajax suggests that the company's growth wasn't really hampered despite it returning most of its income to its shareholders.
Additionally, Wajax has paid dividends over a period of at least ten years which means that the company is pretty serious about sharing its profits with shareholders.
Summary
On the whole, we do feel that Wajax has some positive attributes. True, the company has posted a respectable growth in earnings. However, the earnings growth number could have been even higher, had the company been reinvesting more of its earnings and paying out less dividends. So far, we've only made a quick discussion around the company's earnings growth. You can do your own research on Wajax and see how it has performed in the past by looking at this FREE detailed graph of past earnings, revenue and cash flows.
Have feedback on this article? Concerned about the content? Get in touch with us directly. Alternatively, email editorial-team (at) simplywallst.com.
This article by Simply Wall St is general in nature. We provide commentary based on historical data and analyst forecasts only using an unbiased methodology and our articles are not intended to be financial advice. It does not constitute a recommendation to buy or sell any stock, and does not take account of your objectives, or your financial situation. We aim to bring you long-term focused analysis driven by fundamental data. Note that our analysis may not factor in the latest price-sensitive company announcements or qualitative material. Simply Wall St has no position in any stocks mentioned.
Join A Paid User Research Session
You’ll receive a US$30 Amazon Gift card for 1 hour of your time while helping us build better investing tools for the individual investors like yourself. Sign up here

