Using the Black Friday Indicator to Read the Market
Many retailers, including Walmart (WMT) and Target (TGT), will be closed on Thanksgiving this year. That bucks the trend of the last few years in which stores opened on Thanksgiving and started their Black Friday sales a day early. Black Friday, the day after Thanksgiving, marks the unofficial beginning to the holiday shopping season. Reports of sales, foot traffic and Walmart fist fights will be used to gauge the strength of the consumer and of the economy in general. This made me curious about what happens the week after Black Friday and if that reaction can tell us about the market going forward.
Week After Black Friday
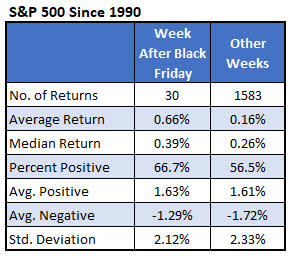
The table below summarizes the S&P 500 Index (SPX) returns for the week after Black Friday going back to 1990. The week has been bullish -- averaging a gain of 0.66% per week -- compared to a 0.16% gain for other weeks since then. Also, the percentage of returns that have been positive is higher than the other weeks (67% vs. 57%). I thought you might see a higher standard deviation during the week because of reactions to the retail shopping data and anecdotes, but that is not the case.
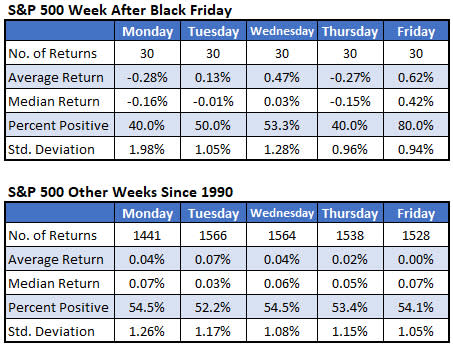
Breaking down the week by day is interesting. Based on this, hold off on buying any stocks. Monday after Black Friday has been a bad day for stocks; it has averaged a loss of 0.28% for the S&P 500 since 1990, with only 40% of the returns positive. In fact, seven of the last eight years, the Monday after Black Friday has been negative. The only day that has been especially bullish has been Friday of next week, which has averaged a gain of 0.62% with 80% of the returns positive.
Black Friday Week Indicator
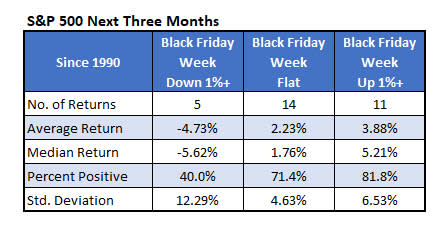
If the Black Friday reports reveal information about the economy, maybe it can tell us about the direction of the stock market. The table below shows how the S&P 500 performed over the next three months depending on whether the week after Black Friday was positive or negative. This has been an excellent indicator at predicting the next three months. When the S&P 500 gained 1% or more the week after Black Friday, the next three months averaged a return of 3.9% with over 80% of the returns positive. When next week has been down by a percent or more, the index lost an average of 4.7% with just 40% of the returns positive.
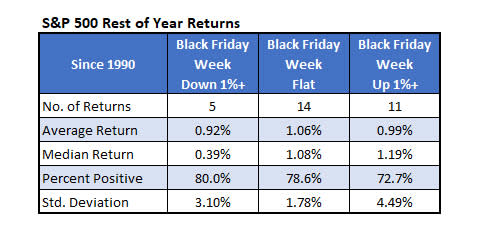
The indicator doesn’t work when you look at a shorter time frame. The table below shows the results for just the rest of the year. Whether the S&P 500 was positive or negative the week after Black Friday, it gained an average of about 1% for the rest of the year, with 75% or 80% of the returns positive.
Notable Stocks Next Week
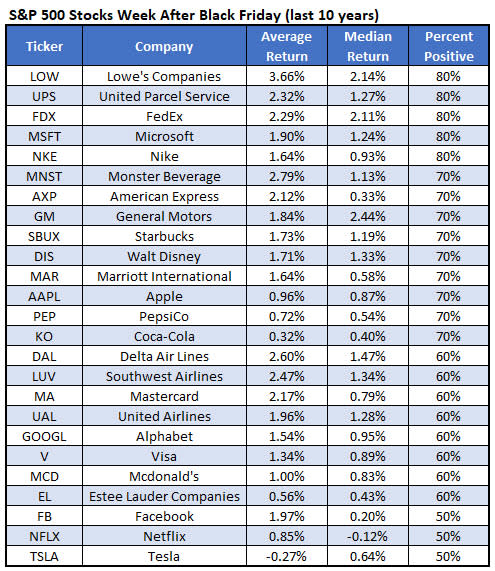
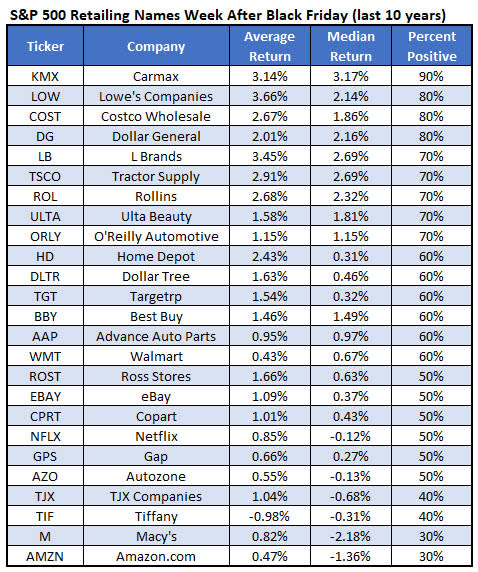
In case anyone’s curious, below are how some S&P 500 stocks from our “General Retailers” sector have performed. The stocks at the top of the list have been the most bullish the week after Black Friday, while those at the bottom have been the most bearish (sorted by percent positive then by average return).
Here is another list of stocks. These stocks aren’t in our “General Retailers” sector, but they’re still interesting stocks around the holidays. Just like above, the stocks at the top of the list have been the most bullish while those at the bottom have been the most bearish.