UF freshman, Palmetto grad dies when car involved in crash careens onto sidewalk, into her
Just a few months ago, Sophia Lambert, a Miami Palmetto High graduate, trekked to Gainesville where she would attend her dream school: the University of Florida.
Though only 18, Lambert had an impressive résumé. The UF theater major and active member of the university’s Delta Phi Epsilon Sorority and the campus’ Jewish community made her mark in Miami last year when she led her school’s student council as well as Temple Judea’s Youth group in Coral Gables. A Girl Scout, she worked as a camp counselor for Atlanta-area children.
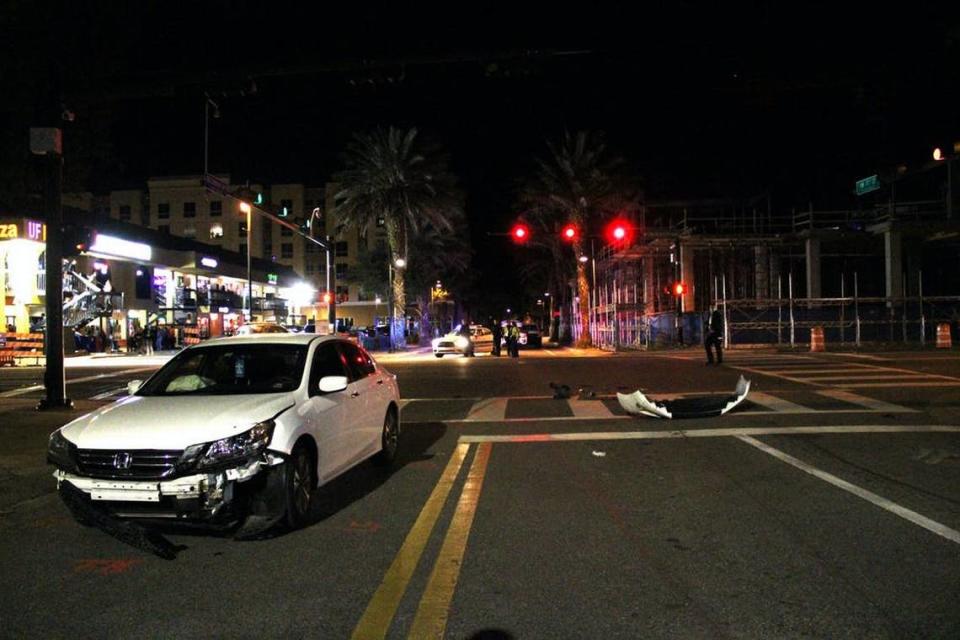
But her bright future came to a halt Saturday night when a car careened into her and four others while they stood on a sidewalk, according to Gainesville police.
The teen’s tragic death happened after a Honda Accord drove westbound on University Avenue. As it tried turning south onto Northwest 17th Street, it crashed into a Honda Civic , which slammed into a pole and hit Lambert and those standing with her on the sidewalk, police said. The identities and conditions of the other four, all students, was not available.
The driver of the Civic was also in the hospital; it could not be determined whether the driver of the Accord was hospitalized or if there were other passengers in either vehicle. According to the Gainesville Sun, the drivers were identified as Benjamin A. Piper, 28, and Boris V. Stoyanov, a 19-year-old UF sophomore studying architecture.
In a statement released Sunday afternoon, University of Florida officials said counseling and support services would be available to students.
“We ask that you please keep Sophia, her family and her community lifted in your thoughts, as well as her classmates who sustained injuries during this tragic accident,” wrote Charlie Lane, UF’s senior vice president, and D’Andra Mull, UF’s vice president of student affairs.
They continued: “We are providing counseling services, outreach and other support for the students and communities affected, and if you need support, please do not hesitate to reach out to us for help. The loss of any student life is unfathomable, and we recognize the effect the loss of one of our own has on the collective community.”
UF’s president, W. Kent Fuchs, posted on Twitter: “My heart, and the heart of the Gator Nation, goes out to the family and friends of UF student Sophia Lambert. We pray for the others injured in Saturday night’s terrible crash and are committed to efforts regarding pedestrian safety on and around campus.”
Lambert’s family requested privacy Sunday but issued a statement: “In due time, the Lambert family will celebrate Sophia’s generous spirit, which shone throughout her short and beautiful life, in ways that will reflect what Sophia cared about most.”
Lambert’s sorority posted a statement on Facebook, describing her as a “beloved sister.”
“In her first semester as a part of our sisterhood, Sophia was a bright light in so many of our lives. Our sisters remember Sophia as a kind, sushi-loving, Broadway enthusiast, outspoken girl who cared for others and loved deeply,” UF Delta Phi Epsilon’s statement said.
“Her passion for theatre and involvement in Dance Marathon, Hillel, politics and Delta Phi Epsilon is a true testament to her character — beautiful inside and out.”
UF Hillel, an organization fostering Jewish campus life, announced there will be “upcoming opportunities to remember Sophia and support one another.”
“Sophia’s warmth and kindness endeared her to all,” Hillel wrote. “She will be greatly missed.”
According to the Independent Alligator, which first reported Lambert’s death, a UF sorority member — Maggie Paxton — was killed in a hit-and-run crash near the site of Saturday’s accident two months earlier. Paxton at the time was the second person to die near the site.
As of 7:30 p.m. Sunday, a petition circulating in the UF community called for the university to act. It had tallied nearly 12,000 signatures.
“There have been too many University of Florida students who have lost their lives or qualities of lives in the past two years. ... We should make a change,” the petition said. “Whether that means lowering the speed limit, putting up barriers between street and road, adding more lighting, or installing more cameras.”
Karina Elwood and Asta Hemenway of the Independent Florida Alligator contributed.

