TRB, RLC and DIA : Oracle Tokens Validate Long-Term Support Levels
Tellor (TRB) has bounced at an ascending support line, but has failed to confirm its bullish trend. iExec RLC (RLC) is attempting to break out from the horizontal resistance level at $4.40. DIA (DIA) has bounced at a long-term ascending support line and is showing bullish reversal signs.
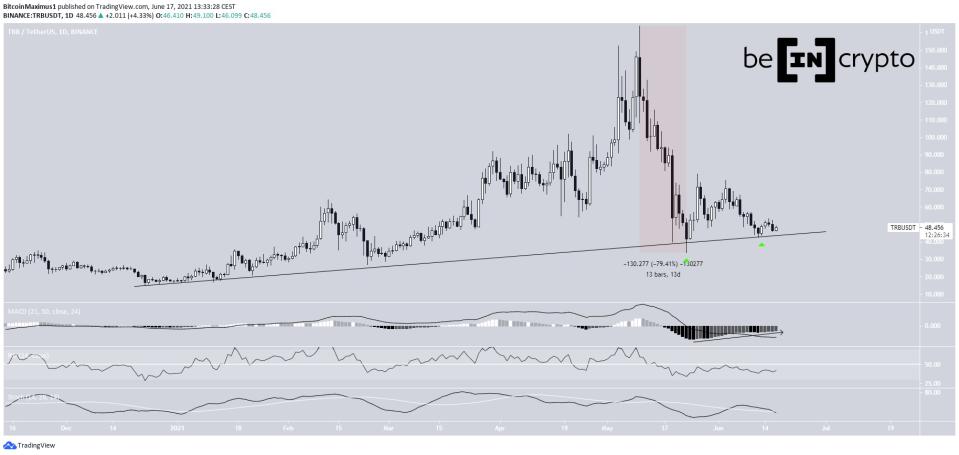
TRB
TRB decreased considerably after reaching an all-time high price of $164.05 on May 10. It fell by 79.40% in only 13 days, culminating with a low of $33.77 on May 23. It has been moving upwards since.
The low validated a long-term ascending support line, in place since Dec. 2020. Afterwards, the token created a higher low on June 12, validating the line once more (green icon).
Despite the bounce, technical indicators are providing mixed signs. While the MACD is increasing, it is not positive yet. In addition, the RSI is still below 50 while the Stochastic oscillator has made a bearish cross.
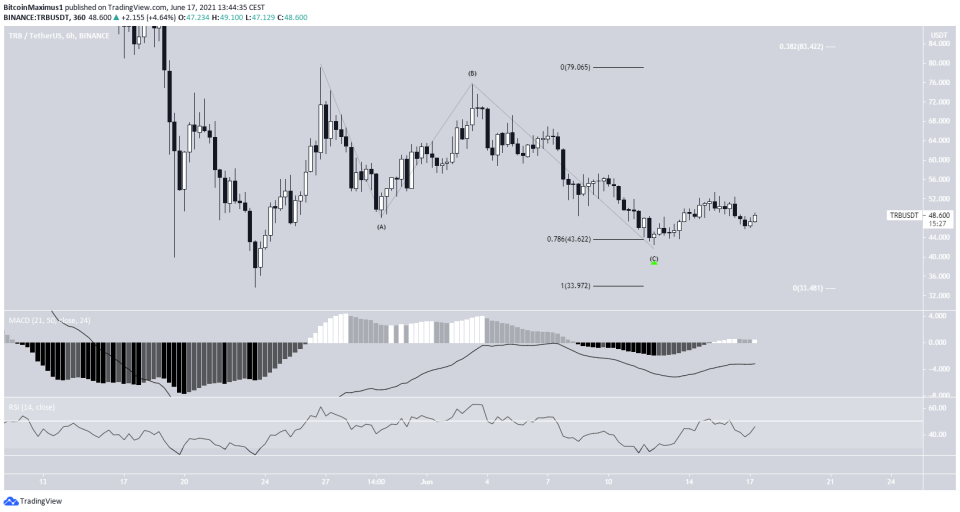
The two-hour chart shows that TRB has bounced at the 0.786 Fib retracement support level (green icon). However, similar to the daily time-frame, technical indicators provide a mixed outlook.
Despite this, the decrease looks like an A-B-C corrective structure, which ended with the aforementioned bounce. In this case, an upward move towards the closest resistance area of $83.4 would be expected. This is the 0.382 Fib retracement resistance level (white).
However, the direction of the longer-term trend cannot be determined.
Highlights
TRB is following an ascending support line.
Technical indicators are neutral.
RLC
RLC reached a low of $3.1 on May 19, but bounced almost immediately afterwards. The upward movement was sharp, leading to a high of $8.93 only two days later.
However, RLC has been falling alongside a descending resistance line since. On June 8, it broke down below the $4.40 area, which had been acting as support (green icon).
However, the token initiated another upward movement and broke out on June 13, making a breakout attempt the next day. However, it was rejected by the $4.40 area (red icon), which is now acting as resistance.
Technical indicators are neutral/bullish. The RSI is attempting to move above 50 but has not yet done so. The MACD is moving upwards but has lost strength.
At the time of writing, we cannot determine whether RLC will break out or not.
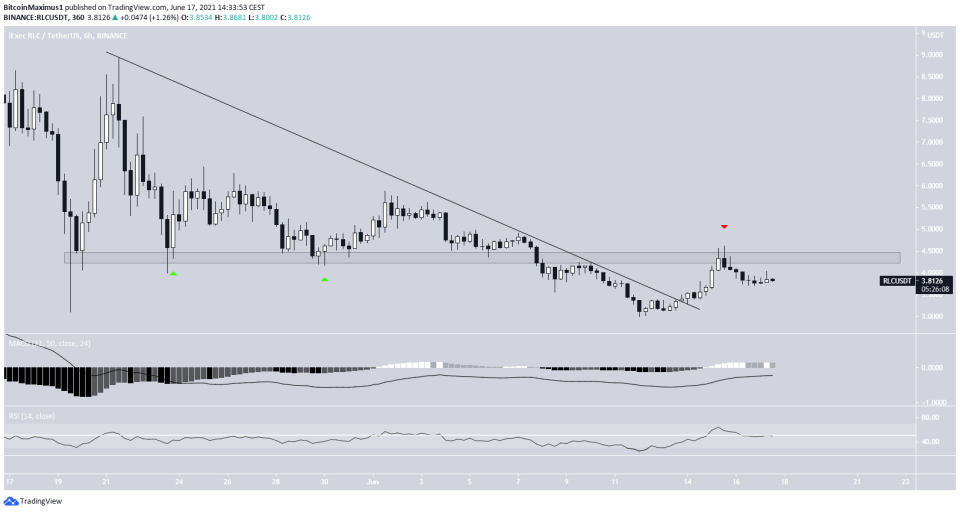
Highlights
RLC is facing resistance at $4.40
It has broken out from a descending resistance line.
DIA
DIA has been falling since it reached an all-time high price of $5.8. The drop continued until a low of $1.25 was reached on May 23. The token has been moving upwards since.
The May 23 low validated an ascending support line that has been in place since Oct. 2020. On June 12, DIA created its first higher low.
Both the RSI & MACD have generated bullish divergence. This is a strong sign of a bullish reversal. Therefore, the most likely movement would have the token increasing towards the $3 resistance area, which is the 0.382 Fib retracement resistance level.
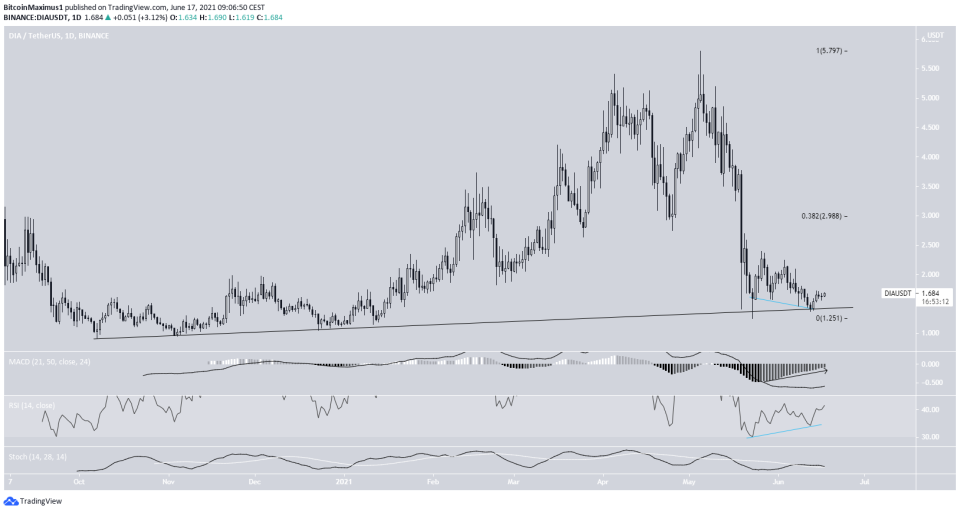
Highlights
DIA is following an ascending support line.
There is resistance near $3.
For BeInCrypto’s latest bitcoin (BTC) analysis, click here.
