Those who invested in RM Infrastructure Income (LON:RMII) five years ago are up 23%
These days it's easy to simply buy an index fund, and your returns should (roughly) match the market. A talented investor can beat the market with a diversified portfolio, but even then, some stocks will under-perform. The RM Infrastructure Income PLC (LON:RMII) stock price is down 13% over five years, but the total shareholder return is 23% once you include the dividend. And that total return actually beats the market decline of 17%.
Now let's have a look at the company's fundamentals, and see if the long term shareholder return has matched the performance of the underlying business.
Check out our latest analysis for RM Infrastructure Income
In his essay The Superinvestors of Graham-and-Doddsville Warren Buffett described how share prices do not always rationally reflect the value of a business. One flawed but reasonable way to assess how sentiment around a company has changed is to compare the earnings per share (EPS) with the share price.
While the share price declined over five years, RM Infrastructure Income actually managed to increase EPS by an average of 18% per year. So it doesn't seem like EPS is a great guide to understanding how the market is valuing the stock. Alternatively, growth expectations may have been unreasonable in the past.
Generally speaking we'd expect to see stronger share price increases on the back of sustained EPS growth, but other metrics may hold a clue to why the share price performance is relatively modest.
The steady dividend doesn't really explain why the share price is down. It's not immediately clear to us why the stock price is down but further research might provide some answers.
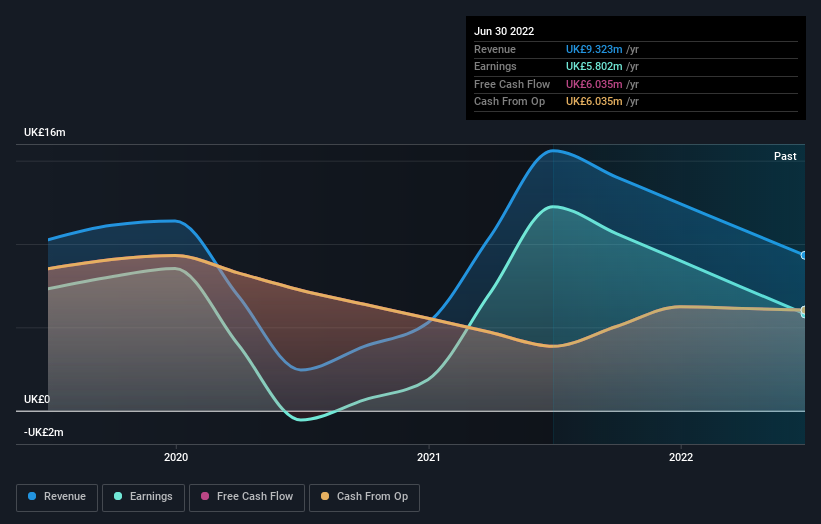
You can see how earnings and revenue have changed over time in the image below (click on the chart to see the exact values).
You can see how its balance sheet has strengthened (or weakened) over time in this free interactive graphic.
What About Dividends?
As well as measuring the share price return, investors should also consider the total shareholder return (TSR). The TSR is a return calculation that accounts for the value of cash dividends (assuming that any dividend received was reinvested) and the calculated value of any discounted capital raisings and spin-offs. So for companies that pay a generous dividend, the TSR is often a lot higher than the share price return. In the case of RM Infrastructure Income, it has a TSR of 23% for the last 5 years. That exceeds its share price return that we previously mentioned. And there's no prize for guessing that the dividend payments largely explain the divergence!
A Different Perspective
It's nice to see that RM Infrastructure Income shareholders have received a total shareholder return of 5.7% over the last year. Of course, that includes the dividend. That gain is better than the annual TSR over five years, which is 4%. Therefore it seems like sentiment around the company has been positive lately. Given the share price momentum remains strong, it might be worth taking a closer look at the stock, lest you miss an opportunity. It's always interesting to track share price performance over the longer term. But to understand RM Infrastructure Income better, we need to consider many other factors. Even so, be aware that RM Infrastructure Income is showing 1 warning sign in our investment analysis , you should know about...
For those who like to find winning investments this free list of growing companies with recent insider purchasing, could be just the ticket.
Please note, the market returns quoted in this article reflect the market weighted average returns of stocks that currently trade on GB exchanges.
Have feedback on this article? Concerned about the content? Get in touch with us directly. Alternatively, email editorial-team (at) simplywallst.com.
This article by Simply Wall St is general in nature. We provide commentary based on historical data and analyst forecasts only using an unbiased methodology and our articles are not intended to be financial advice. It does not constitute a recommendation to buy or sell any stock, and does not take account of your objectives, or your financial situation. We aim to bring you long-term focused analysis driven by fundamental data. Note that our analysis may not factor in the latest price-sensitive company announcements or qualitative material. Simply Wall St has no position in any stocks mentioned.
Join A Paid User Research Session
You’ll receive a US$30 Amazon Gift card for 1 hour of your time while helping us build better investing tools for the individual investors like yourself. Sign up here

