Texas home builders “scrambling” as interest rates rise

HomesUSA.com reports lower prices, higher inventory as home sales stabilize
Ben Caballero, HomesUSA.com

Chart 1: HomesUSA.com Texas New Home Sales Index – Days on Market (exclusive)

Chart 2: Texas New Home Sales
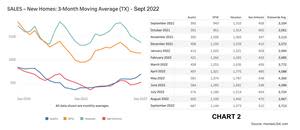
Chart 3: Texas New Home Sales Prices

Chart 4: Texas Sales-to-List-Price Ratio

Chart 5: Texas Pending New Home Sales

Chart 6: Texas Active Listings for New Home Sales
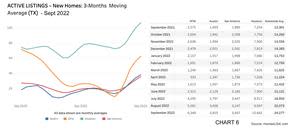
Chart A: Texas 12-Month Moving Averages

DALLAS, Oct. 19, 2022 (GLOBE NEWSWIRE) -- Texas home builders are responding to higher interest rates by offering incentives to buyers and higher commissions and bonuses, according to Ben Caballero, the nation’s top-ranked real estate agent and CEO of HomesUSA.com.
Caballero notes the move by builders is in response to rising interest rates in an attempt to avoid significant price markdowns. In addition, rising inventory is causing home builders to list more homes for sale in the MLS, according to the latest HomesUSA.com New Home Sales report.
“With inventory increasing, and the pace of new home sales starting to slow, builders are implementing multiple strategies to avoid price reductions,” said Caballero.
"Home buyers should remember that while you marry the home, you date your rate," Caballero added, noting that most people refinance their purchase loan in the future.
According to the HomesUSA.com New Home Sales report, while the 3-month average of September home sales statewide last month was marginally higher, however in Texas’ two biggest markets, Dallas-Ft Worth and Houston saw new home sales down slightly. The Dallas-Ft. Worth home sales in September were 1,144 versus 1,149 in August, and Houston's September sales were 1,373 versus 1,442 in August. In Austin, September home sales were 687 versus 605 in August, and in San Antonio, September home sales were 510 versus 470 in August.
The HomesUSA.com New Home Sales Index shows the new home sales pace slowed slightly for the first time in six months as the 3-month moving average for Days on Market was 50.96 days versus 50.87 days in August.
The HomesUSA.com New Home Sales report uses data from the REALTOR Associations of Austin, North Texas, Houston, and San Antonio.
The 3-month average of new home prices in Texas was $467,956 in September, down from $472,129 in August. New home prices were lower last month in Dallas-Ft. Worth, Austin, and San Antonio, but Houston's average home price was higher.
The 3-month moving average of new home prices in September in Dallas-Ft. Worth was $502,686 versus $512,934 in August. Austin's September average new home price was $541,563 versus $555,927 the prior month, while the average price in San Antonio was $400,473 versus $406,099 in August.
The one anomaly was Houston, where the average new home price set another record at $429,225 versus $426,115 in August.
As Caballero noted, statewide active new home sale listings reported to the MLSs increased last month. In September, the 3-month average of active new home listings statewide was 24,277 versus 22,073 in August. All four major new home markets in Texas – Houston, Dallas-Ft. Worth, Austin, and San Antonio – reported an increase in active new home listings last month.
The HomesUSA.com Texas New Home Sales Report and New Home Sales Index are being shared in advance of the Commerce Department’s release of its nationwide New Residential Sales Report for September, set for Wednesday, October 26 at 10:00 am Eastern.
The HomesUSA.com monthly report includes 3-month and 12-month moving averages for six essential market data, including Days on Market, sales volume, sales prices, a sales-to-list price ratio, pending sales, and active listings. Caballero explained the 3-month moving average indices track market seasonality, while the 12-month moving average removes the seasonality and tracks the longer trend.
Days on Market – New Homes in Texas (Exclusive Data)
The HomesUSA.com New Home Sales Index showed the 3-month moving average of Days on Market increased statewide and in three of the four major new home markets in August. Houston’s DOM was 60.51 days versus 59.41 days in August. In San Antonio, the DOM was 56.69 days versus 55.31 days in August. In Austin, the DOM increased to 28.70 days versus 27.90 days in August. Dallas-Ft. Worth was the exception, as its DOM decreased to 50.31 days from 50.54 days in August. (See Chart 1: Texas New Homes Days on Market)
Texas New Home Sales Data
Based on all available local MLS data, total new home sales in Texas were higher statewide, but lower in two of the four major new home markets last month, according to the 3-month moving average. In Houston, September’s total sales were 1,373 versus 1,442 in August. Dallas-Ft. Worth new home sales also decreased to 1,144 versus 1,149 in August. In San Antonio, new home sales increased to 510 from 470 in August. In Austin, September sales totaled 687 versus 605 in August. (See Chart 2: Texas New Home Sales)
Texas New Home Prices
The average price of new homes in Texas shows lower prices statewide and in three of the four major new home markets last month. Dallas-Ft. Worth reported its 3-month moving average price for new homes was lower in September at $502,686 versus $512,934 in August. Austin's 3-month moving average price decreased in September to $541,563 from $555,927 in August. In San Antonio, the average new home price also decreased in September at $400,473 versus $406,099 in August. Houston was the exception, as its average new home price was higher in September at $429,225 versus $426,115 in August. (See Chart 3: Texas New Home Prices)
Texas Sales-to-List Price Ratio
New home sales statewide and in Dallas-Ft. Worth, Houston, Austin, and San Antonio still hover near 100 percent of the asking price and in one market, exceeded it. Statewide, the 3-month moving average of the sales-to-list price ratio in September was 99.29 versus 99.61 percent in August. Dallas-Ft. Worth’s ratio was 99.65 versus 100.23 percent in August. In Houston, the ratio was 98.49 versus 98.76 percent in August. In Austin, the sales-to-price ratio in September was 100.18 versus 100.49 percent in August. San Antonio's ratio in September was 99.45 versus 99.61 percent in August. (See Chart 4: Texas Sales-to-List Price Ratio)
Texas Pending New Homes Sales Data
Based on local MLS data, pending new home sales rose statewide and in all four Texas major new home markets last month. Statewide MLS data shows pending sales in September were 4,412 versus 4,308 in August. In Houston, pending sales in September were 1,570 versus 1,566 in August. Pending new home sales last month in Dallas-Ft. Worth were 1,659 versus 1,619 in August. In Austin, pending sales in September were 670 versus 646 in August. In San Antonio, pending sales last month were 514 versus 477 in August. (See Chart 5: Texas Pending New Home Sales)
Texas Active Listings for New Homes
MLS data shows the 3-month moving average for active listings statewide increased in September to 24,277 versus 22,073 in August. Last month, all four major Texas new home markets posted higher active listings. Dallas-Ft. Worth's active listings in September were 6,249 versus 5,581 in August. Last month's active listings in Houston were 10,642 versus 9,937 in August. September’s active listings in Austin were higher at 3,819 versus 3,408 in August. San Antonio reported active new home listings in September were 3,567 versus 3,147 in August. (See Chart 6: Texas Active Listings and Chart A: 12-Month Moving Averages)
About the HomesUSA.com New Home Sales Index
The HomesUSA.com Index is reported as both a 3-month and 12-month moving average of the Days on Market (DOM) for new homes listed in the local Multiple Listing Services (MLSs) for the four largest Texas markets, including Dallas-Ft. Worth, Houston, Austin, and San Antonio. Created by Ben Caballero, founder and CEO of HomesUSA.com, it is the first Days on Market index to track Texas’ new home market and includes homes listed while under construction.
About Ben Caballero and HomesUSA.com®
Ben Caballero, founder and CEO of HomesUSA.com, is a three-time Guinness World Record title holder for ‘Most annual home sale transactions through MLS by an individual sell-side real estate agent – current.’ Ranked by REAL Trends as America’s top real estate agent for home sales since 2013, Ben is the most productive real estate agent in U.S. history. He is the only agent to exceed $1 billion in residential sales transactions in a single year, a feat first achieved in 2015 and repeated each year through 2018 when he achieved more than $2 billion. An award-winning innovator and technology pioneer, Ben works with more than 60 home builders in Dallas-Fort Worth, Houston, Austin, and San Antonio. His podcast series is available on iTunes and Google Podcasts. Learn more at HomesUSA.com |Twitter: @bcaballero - @HomesUSA | Facebook: /HomesUSAdotcom.
Note for journalists: You may contact Ben Caballero directly on his cell at (214) 616-9222 or by email at ben@homesusa.com.
REALTOR® is a federally registered collective membership mark which identifies a real estate professional who is a member of the NATIONAL ASSOCIATION OF REALTORS® and subscribes to its strict Code of Ethics.
Media Contact:
Kevin Hawkins
(206) 866-1220
kevin@wavgroup.com
Image: Ben Caballero
https://www.homesusa.com/wp-content/uploads/2018/09/Ben-Caballero-Portrait-Grey-4288x2848.jpg
Individual Chart images:
Chart 1: Texas New Homes Tracking – Days on Market – September 2022: https://homesusa.com/wp-content/uploads/2022/10/Chart-1-Texas-Days-on-Market.jpg
Chart 2: Texas New Home Sales Market – September 2022: https://homesusa.com/wp-content/uploads/2022/10/Chart-2-Texas-New-Home-Sales.jpg
Chart 3: Texas New Home Sales Prices Market – September 2022: https://homesusa.com/wp-content/uploads/2022/10/Chart-3-Texas-New-Home-Sales-Prices.jpg
Chart 4: Texas Sales-to-List-Price Ratio Market – September 2022: https://homesusa.com/wp-content/uploads/2022/10/Chart-4-Texas-Sales-to-List-Price-Ratio.jpg
Chart 5: Texas Pending New Home Sales Market – September 2022: https://homesusa.com/wp-content/uploads/2022/10/Chart-5-Texas-Pending-New-Home-Sales.jpg
Chart 6: Texas Active Listings for New Homes Market – September 2022: https://homesusa.com/wp-content/uploads/2022/10/Chart-6-Texas-Active-Listings.jpg
Chart A: Texas 12-Month Moving Averages Market – September 2022: https://homesusa.com/wp-content/uploads/2022/10/Chart-A-12MonthChart-DataOnly.jpg

