QL Resources Berhad's (KLSE:QL) largest shareholders are private companies who were rewarded as market cap surged RM511m last week
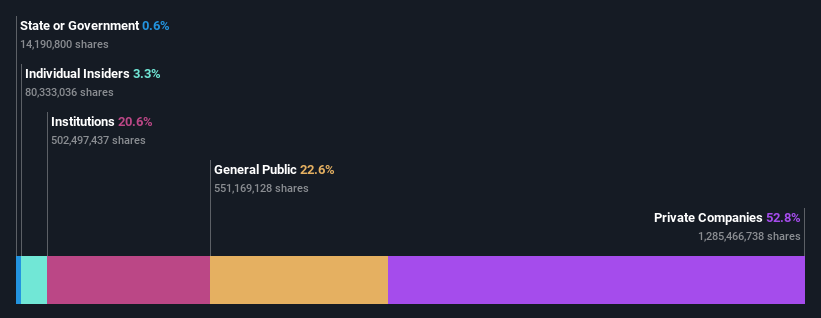
Every investor in QL Resources Berhad (KLSE:QL) should be aware of the most powerful shareholder groups. With 53% stake, private companies possess the maximum shares in the company. Put another way, the group faces the maximum upside potential (or downside risk).
Clearly, private companies benefitted the most after the company's market cap rose by RM511m last week.
In the chart below, we zoom in on the different ownership groups of QL Resources Berhad.
View our latest analysis for QL Resources Berhad
What Does The Institutional Ownership Tell Us About QL Resources Berhad?
Many institutions measure their performance against an index that approximates the local market. So they usually pay more attention to companies that are included in major indices.
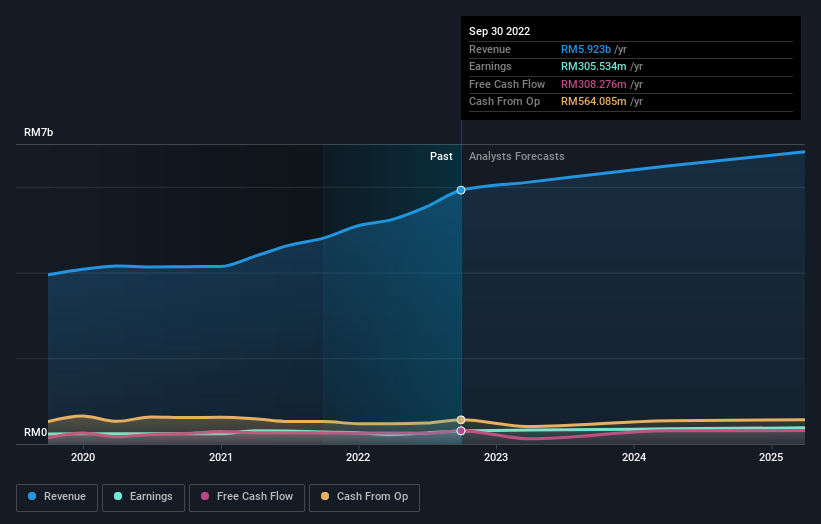
QL Resources Berhad already has institutions on the share registry. Indeed, they own a respectable stake in the company. This implies the analysts working for those institutions have looked at the stock and they like it. But just like anyone else, they could be wrong. It is not uncommon to see a big share price drop if two large institutional investors try to sell out of a stock at the same time. So it is worth checking the past earnings trajectory of QL Resources Berhad, (below). Of course, keep in mind that there are other factors to consider, too.
QL Resources Berhad is not owned by hedge funds. Our data shows that Cbg (L) Pte Ltd is the largest shareholder with 40% of shares outstanding. For context, the second largest shareholder holds about 12% of the shares outstanding, followed by an ownership of 5.2% by the third-largest shareholder.
After doing some more digging, we found that the top 2 shareholders collectively control more than half of the company's shares, implying that they have considerable power to influence the company's decisions.
Researching institutional ownership is a good way to gauge and filter a stock's expected performance. The same can be achieved by studying analyst sentiments. There are plenty of analysts covering the stock, so it might be worth seeing what they are forecasting, too.
Insider Ownership Of QL Resources Berhad
The definition of an insider can differ slightly between different countries, but members of the board of directors always count. Management ultimately answers to the board. However, it is not uncommon for managers to be executive board members, especially if they are a founder or the CEO.
Most consider insider ownership a positive because it can indicate the board is well aligned with other shareholders. However, on some occasions too much power is concentrated within this group.
We can see that insiders own shares in QL Resources Berhad. The insiders have a meaningful stake worth RM454m. Most would see this as a real positive. If you would like to explore the question of insider alignment, you can click here to see if insiders have been buying or selling.
General Public Ownership
The general public-- including retail investors -- own 23% stake in the company, and hence can't easily be ignored. While this size of ownership may not be enough to sway a policy decision in their favour, they can still make a collective impact on company policies.
Private Company Ownership
We can see that Private Companies own 53%, of the shares on issue. It's hard to draw any conclusions from this fact alone, so its worth looking into who owns those private companies. Sometimes insiders or other related parties have an interest in shares in a public company through a separate private company.
Next Steps:
I find it very interesting to look at who exactly owns a company. But to truly gain insight, we need to consider other information, too.
I like to dive deeper into how a company has performed in the past. You can find historic revenue and earnings in this detailed graph.
If you would prefer discover what analysts are predicting in terms of future growth, do not miss this free report on analyst forecasts.
NB: Figures in this article are calculated using data from the last twelve months, which refer to the 12-month period ending on the last date of the month the financial statement is dated. This may not be consistent with full year annual report figures.
Have feedback on this article? Concerned about the content? Get in touch with us directly. Alternatively, email editorial-team (at) simplywallst.com.
This article by Simply Wall St is general in nature. We provide commentary based on historical data and analyst forecasts only using an unbiased methodology and our articles are not intended to be financial advice. It does not constitute a recommendation to buy or sell any stock, and does not take account of your objectives, or your financial situation. We aim to bring you long-term focused analysis driven by fundamental data. Note that our analysis may not factor in the latest price-sensitive company announcements or qualitative material. Simply Wall St has no position in any stocks mentioned.
Join A Paid User Research Session
You’ll receive a US$30 Amazon Gift card for 1 hour of your time while helping us build better investing tools for the individual investors like yourself. Sign up here
