Putting the Overnight Indicator to the Test
It is a safe assumption that after-hours trading is dominated by big institutions and more sophisticated investors. If that is true and if these investors are superior to mere intraday investors, stocks being bought in the after-hours should outperform in the longer run. In the analysis below, I run some numbers to see if there is a potential indicator here.
Are Overnight Returns a Viable Indicator?
For this study, I looked at liquid optionable stocks over the past five years. I compared the overnight return for the stocks to the S&P 500 Index ETF (SPY), then counted the number of consecutive days a stock outperformed or underperformed the SPY. I thought this was a reasonable way to measure persistent buying or selling pressure by overnight traders. I then found the return for the stock over the next month of trading.
If the theory I put forth is correct, stocks that have outperformed the SPY for several consecutive days should have better returns going forward than those that have underperformed the ETF for several consecutive days. This would indicate overnight buyers are getting in on specific stocks at the right time.
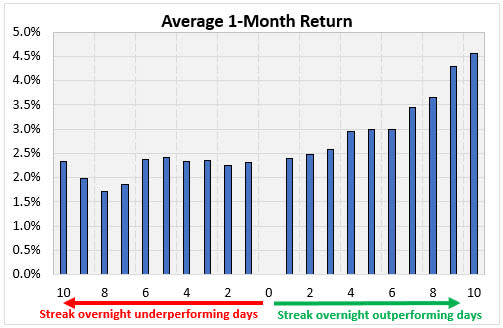
To explain the chart below, the x-axis is the number of days a stock did better or worse than the SPY in after-hours trading. The numbers to the right are consecutive days a stock outperformed the ETF, and to the left are the consecutive number of days a stock underperformed the ETF. I threw out the small number of times a stock had the same exact return as the SPY so there is nothing for zero. I also disregarded streaks in either direction of more than ten because the number of returns was shrinking fast at that point.
I did not know what to expect running these numbers, but this looks like a viable indicator. Stocks undergoing streaks of beating the SPY in the after-hours had a better one-month return than other stocks. For example, after eight-straight days of beating the SPY overnight, stocks averaged a gain of 3.65% over the next month. Stocks that did worse than the SPY for eight consecutive days only averaged 1.72% over the next month.
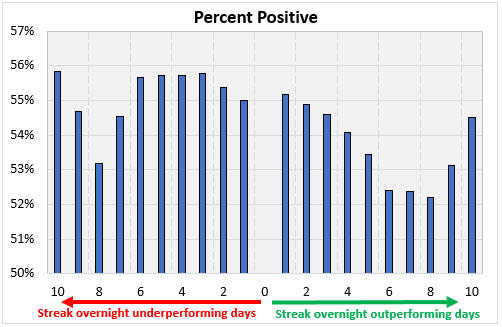
The chart below, showing the percentage of positive returns, does not look like the chart above, surprisingly. Stocks that beat the SPY overnight several days in a row are not more likely to have a positive return over the next month. In fact, they’re slightly less likely. So, using this indicator you would have had a higher return, which is what counts, but your win rate would have been slightly lower.
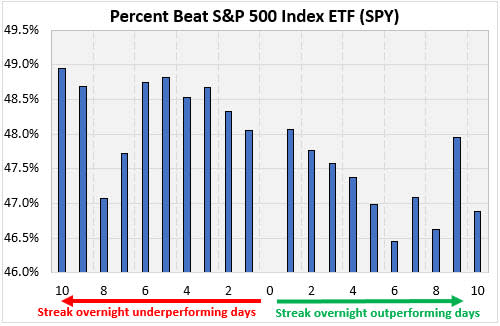
Finally, I looked at how likely the stocks were to outperform the SPY benchmark over the next month. The stocks with a streak of outperforming the SPY in the after-hours were less likely to outperform the market even though, as we see above, they tended to have a higher average return. The difference is slight (the y-axis ranges only from 46% to 49.5%) but it’s there. Nevertheless, if you see a stock consistently doing well overnight, it might be one to look into buying.
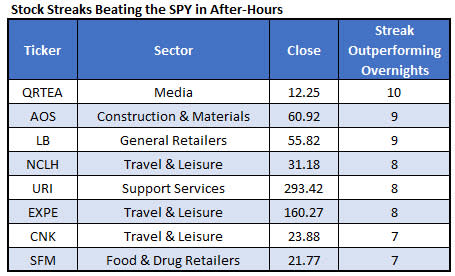
Stocks Overnight Traders are Currently Buying
Finally, here is a list of stocks that keep outperforming the SPY in the after-hours. Based on the analysis above, these stocks can outperform over the next month.