Market Wrap: Bitcoin's Price Retraces Again, Breaks Below Trendline
Price Action
BTC continues a reversion to the mean, drops below $24,000.
Bitcoin (BTC) declined 1% on Tuesday, marking the second consecutive day of declines for the largest cryptocurrency by market capitalization. Bitcoin’s slide, which was discussed in Tuesday’s First Mover: Americas, began in overnight trading.
Ether’s (ETH) price fell 1.1%, reversing gains made overnight. The second-largest cryptocurrency by market capitalization fell below $1,900 after hovering over that threshold for much of the past week.
This article originally appeared in Market Wrap, CoinDesk’s daily newsletter diving into what happened in today's crypto markets. Subscribe to get it in your inbox every day.
ETH’s total market capitalization is now 50% of BTC’s, approaching levels last seen in January. Viewing ETH’s market cap by comparison to BTC’s indicates the potential for a “flippening” event, where ETH’s total market cap exceeds BTC’s.
According to a report from research firm FSInsight, ether could approach bitcoin’s market cap over the next 12 months. ETH reached 83.2% of BTC’s market cap in June 2017, its highest level to date.
The report attributes the potential occurrence to the Ethereum network’s switch from a proof-of-work platform to a faster, more energy-efficient proof-of-stake one.
Traditional markets were mixed, as the S&P 500 and Nasdaq Composite index sank 0.2% and 0.5%, respectively, while the Dow Jones Industrial Average rose 0.6%
Commodities were also mixed with crude oil down by 3.7%, while natural gas increased 7.7%. Gold, a traditional safe-haven asset, declined 0.37%
Major altcoin prices were largely down with SOL and AVAX declining 2.4% and 1.02%, respectively.
Latest Prices
●Bitcoin (BTC): $23,960 −0.3%
●Ether (ETH): $1,883 −0.9%
●S&P 500 daily close: 4,305.20 +0.2%
●Gold: $1,791 per troy ounce +0.5%
●Ten-year Treasury yield daily close: 2.82% +0.03
Bitcoin, ether and gold prices are taken at approximately 4pm New York time. Bitcoin is the CoinDesk Bitcoin Price Index (XBX); Ether is the CoinDesk Ether Price Index (ETX); Gold is the COMEX spot price. Information about CoinDesk Indices can be found at coindesk.com/indices.
Technical Take
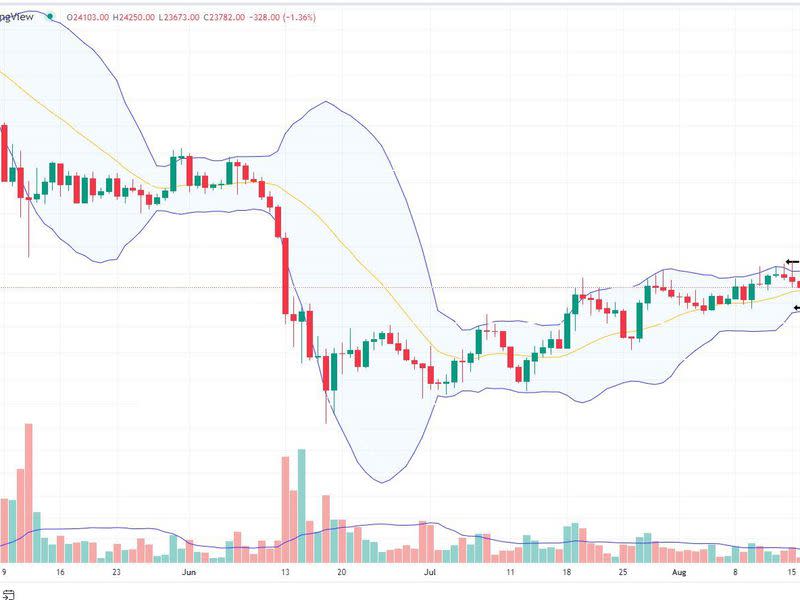
BTC prices fall to 20-period moving average after breaching upper Bollinger Band
BTC’s price continued a reversion to the mean, a topic that was discussed in Monday’s Market Wrap. That analysis highlighted BTC’s proximity to the upper range of its “Bollinger Band,” which periodically has resulted in BTC’s price declining to or below its 20-day moving average.
BTC’s current 20-day moving average price is about $23,600, which would imply at least an additional 1% of downside if prices were to behave as they have in the past.
Traders who make use of Bollinger Bands have also used the 20-period MA or below as an area to add to long positions, viewing that as a solid entry point. Traders who expect prices to extend beyond the upper range are prone to add to positions at the moving average itself. Those who believe the moving average represents a solid valuation are prone to add to positions if prices fell below it, because they believe that prices will eventually increase to the average.
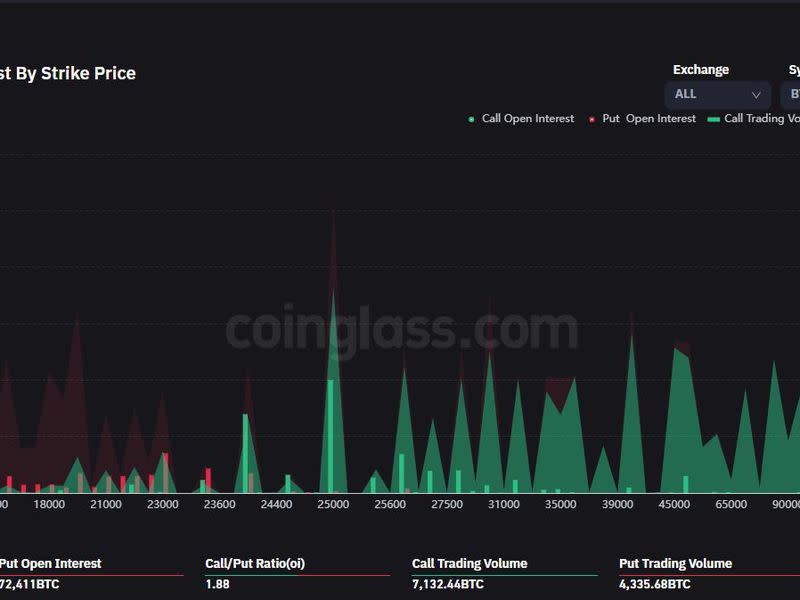
BTC’s price reversion remains in an area of solid option buying activity.
Despite the decreasing price, there appears to be bullish sentiment around current price levels. Call open interest exceeds put open interest, resulting in a call/put ratio of 1.88. This is slightly higher than the call/put ratio of 1.85 observed on Aug. 10.
A call represents the right but not the obligation to purchase an asset at a specific price, while a put represents the right but not the obligation to sell an asset at a specified price. Open interest represents the number of active options contracts.
The ratio of calls to puts is an asset’s call/put ratio, and a ratio in excess of one indicates a greater number of calls than puts. The extent to which calls exceed implies bullish sentiment.
Options open interest by strike price shows a concentration of open interest at the $23,000, $24,000 and $25,000 strike prices. In the case of the $24,000 and $25,000 strike prices, the open interest for calls exceeds the open interest of puts.
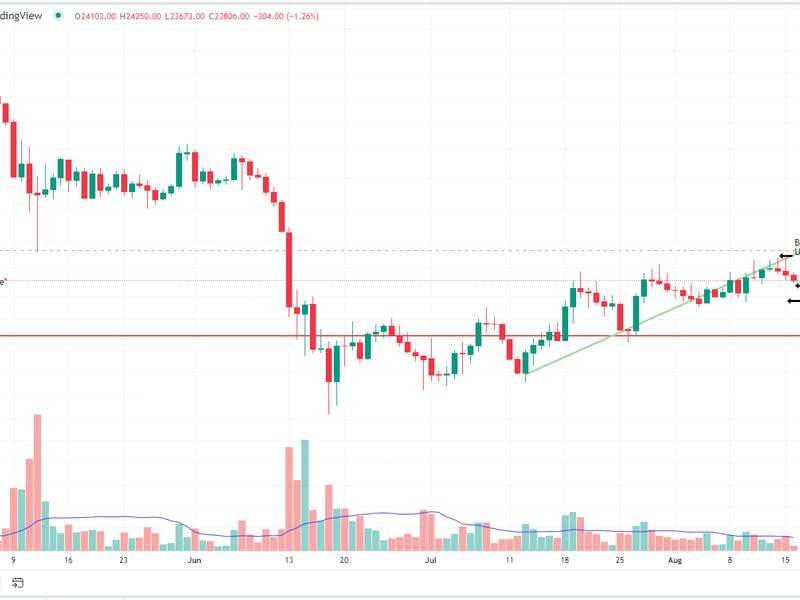
BTC has broken below its trendline.
BTC has broken below the trendline that the Aug. 3 Market Wrap highlighted. Using the same chart as above, but removing the Bollinger Bands for visual clarity, shows that prices have broken below trend. BTC prices will need to increase about 3% on Tuesday or 6% on Wednesday to recapture their uptrend.
Overlaying (left axis) the volume profile visible range, or VPVR, on the same chart illustrates high levels of volume at the $23,800 price point, which coincides with the 20-period MA. The VPVR displays trading activity over a certain period of time across specified price levels.
Traders may be interested in the extent to which volume declines in the price points between $23,700 and $30,000.
Historically, these “low volume nodes” represent areas where prices are prone to move quickly. This factor, in conjunction with BTC’s proximity to its 20-period MA and the level of call options at the $24,000 and $24,000 strikes, could provide a boost to prices in the near future.
Altcoin roundup
Crypto Derivatives Traders Bet on Ether Staking Yields Doubling to 8% Post-Merge: The major Ethereum overhaul known as the Merge looks poised to make staking the blockchain's ether (ETH) tokens more rewarding than ever. Ether's price has surged recently in anticipation of the Merge, and the higher yields foreseen by derivatives traders would further enrich the ecosystem. Read more here.
Jump Crypto Picked to Revamp Solana: The cryptocurrency arm of Chicago-based TradFi giant Jump Trading Group is trying to revamp a core part of Solana’s infrastructure, seeking to boost the throughput and reliability of a network that’s been plagued by frequent outages and slowdowns. Read more here.
Argentina Ethereum Conference Highlights Crypto’s Growing Reach in the Country: The country continues to serve as a hotbed of crypto innovation even as it faces its latest financial crisis. ETHLatam drew more than 4,000. Read more here.
Relevant insight
Listen 🎧: Today’s "CoinDesk Markets Daily" podcast discusses the latest market movements and the cost of Web2 convenience.
Tornado Cash Sanctions Are Spiraling Into Compliance Nightmares: The crypto mixer’s sanctions issue raises many questions.
Tornado Cash US Ban Is ‘Bad Precedent,’ but Monero Was ‘Made for This,’ Cake Wallet Exec Said: Justin Ehrenhofer, vice president of operations at Cake Wallet, joined CoinDesk TV’s “First Mover” to discuss the implications of government regulation when it comes to privacy coins.
IPOR Labs Unveils Protocol to Make DeFi Credit Markets More Transparent and Stable: Traders will be able to hedge, arbitrage and take directional positions based on interest rate movements to manage risk across their credit portfolios on the Ethereum blockchain.
Crypto Twitter Sees 'Bearish Wedge' Pattern in Bitcoin's Price Recovery: The rising wedge – a pattern that has appeared in bitcoin's price charts – has some analysts and traders calling for a renewed sell-off toward $16,400.
Unstoppable Domains Streamlines Use of Web3 Identities Through iPhone App: The domain provider’s iOS app aims to foster Web3 accessibility, interoperability and – soon – community.
Crypto Investment Firm Digital Currency Group Registers Executive as Lobbyist: The company's Grayscale unit has sued the SEC for rejecting its spot bitcoin ETF application.
Bitcoin Miner PrimeBlock Cancels Listing Plans, Terminates $1.25B Merger With 10X Capital: The two firms terminated their agreement, which would have allowed Prime Blockchain to go public, by mutual consent on Aug. 12
Brazil's Largest Investment Bank, BTG Pactual, Launches Crypto Trading Platform: Called Mynt, the product allows customers to trade BTC, ETH, SOL, DOT and ADA.
Huobi to End Crypto Derivatives Trading in New Zealand: The Seychelles-based cryptocurrency exchange cited "local compliance policies."
Tencent Halts NFT Sales on Its Huanhe Platform Amid Regulatory Scrutiny, Reuters Reports: Users will still be able to hold, display or request a refund for their digital tokens.
Other markets
Biggest Gainers
Asset | Ticker | Returns | DACS Sector |
|---|---|---|---|
Dogecoin | +9.9% | ||
Gala | +4.0% | ||
Shiba Inu | +2.1% |
Biggest Losers
Asset | Ticker | Returns | DACS Sector |
|---|---|---|---|
Loopring | −3.9% | ||
Decentraland | −2.5% | ||
Chainlink | −2.2% |
Sector classifications are provided via the Digital Asset Classification Standard (DACS), developed by CoinDesk Indices to provide a reliable, comprehensive and standardized classification system for digital assets. The CoinDesk 20 is a ranking of the largest digital assets by volume on trusted exchanges.

