The Magnificent Seven: QNT, AMP, FTM, TFUEL, WAVES, SHIB, THETA— Biggest Gainers, June 11-18
BeInCrypto takes a look at the seven altcoins that increased the most over the past seven days, from June 11 to June 18.
These altcoins are:
Quant (QNT) : 43.59%
Amp (AMP): 33.00%
Fantom (FTM): 17.31%
Theta Fuel (TFUEL): 13.40%
Waves (WAVES): 13.39%
SHIBA INU (SHIB): 10.46%
THETA (THETA): 9.65%
QNT
QNT has been increasing since it bounced at a long-term ascending support line on May 23 (Green icon). The increase continued until a new all-time high price of $84.92 was reached on June 17. The high was very close to the 1.61 external Fib retracement level at $89.27, a likely reversal area.
Currently, QNT is trying to find support above the previous all-time high near $64.33.
Technical indicators are still bullish, supporting the continuation of the upward movement.

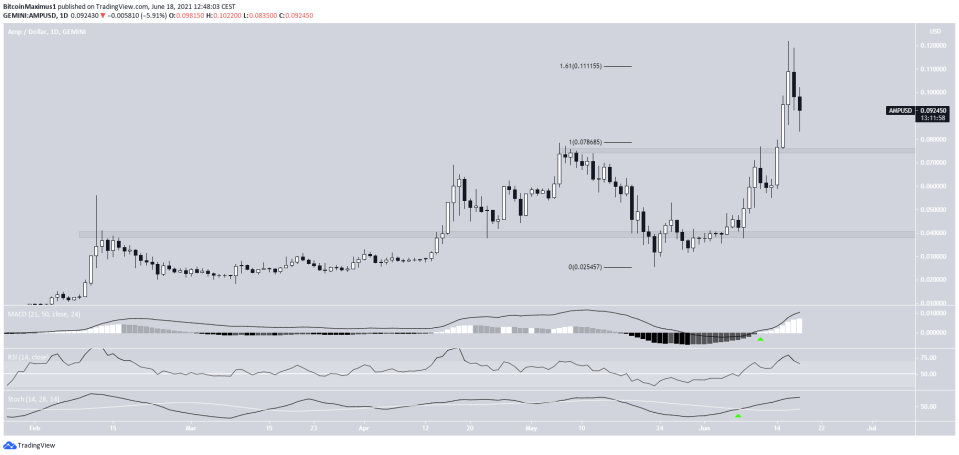
AMP
AMP has been increasing since it reached a low of $0.023 on May 23. While it was initially rejected by the $0.076 resistance area, it managed to break out eventually.
Similarly to QNT, it reached a new all-time high of $0.121 on June 16. The high was made right at the 1.61 external retracement resistance level at $0.11.
Currently, AMP is decreasing towards the previous resistance of $0.076, which is now expected to act as support.
Technical indicators in the daily time-frame are still bullish, as evidenced by the positive MACD and bullish cross in the Stochastic oscillator (green icons).
FTM
FTM has been decreasing alongside a descending support line since Feb. 23. The line has been validated five times, most recently on June 12 (green icon), initiating the current upward movement.
The bounce was preceded by bullish divergence in the MACD, RSI & Stochastic oscillator, increasing its significance.
If the upward movement continues, the next closest resistance would be at $0.477, the 0.382 Fib retracement resistance level.

TFUEL
TFUEL broke out from a descending parallel channel on June 1 (green icon). It managed to reach a new all-time high price on June 9. However, it fell shortly afterwards. The high was made at a potential Fib extension resistance level at $0.69 (white).
After the drop, TFUEL bounced at the $0.47 area, validating it as support. As long as it is trading above this level, the trend is considered bullish.
It is likely that the upward movement is part of wave five of a bullish impulse. If it extends, it could take the token all the way to $1.02.
However, technical indicators are beginning to show weakness, as evidenced by the potential bearish cross in the Stochastic oscillator (red circle).

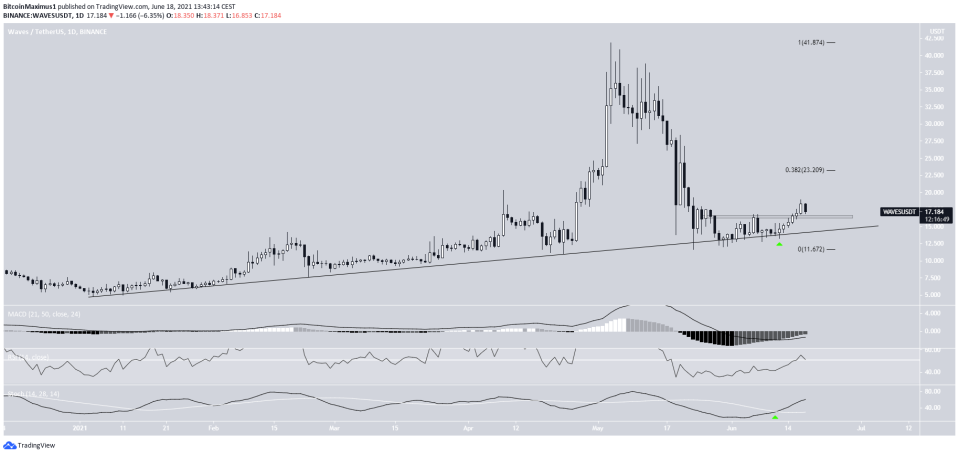
WAVES
WAVES has been following an ascending support line since the beginning of the year. It validated it numerous times, most recently on June 12, initiating the current upward movement.
After breaking out, the token is now attempting to hold the $16.40 area as support.
Technical indicators are providing some bullish signs, such as the bullish cross in the Stochastic oscillator. However, they are not sufficient to confirm the bullish reversal.
The next closest resistance area is at $23.20.
SHIB
SHIB reached an all-time low price of $0.0000055 on June 12. It has been increasing since, and on June 15 it managed to break out from a descending resistance line.
It is currently attempting to validate it as support. If successful, it would likely increase towards the next resistance level at $0.00001450. If not, it would likely fall towards a new all-time low.

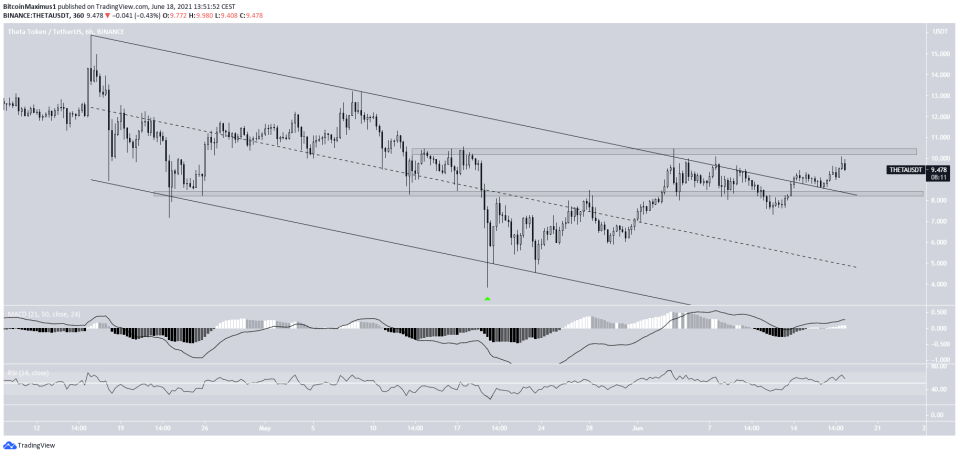
THETA
THETA has been increasing since May 19, when it bounced at the support line of a descending parallel channel. After reclaiming the $8.35 area, it broke out from the channel.
It is currently trading just below the $10.35 resistance area. A breakout above it could trigger a sharp upward movement.
Technical indicators are bullish, since both the RSI & MACD are increasing.
For BeInCrypto’s latest bitcoin (BTC) analysis, click here.

