LTC Gets Hit Hard by Correction — Will It Bounce?
Litecoin (LTC) managed to reach a new all-time high price of $417 on May 10.
While it has decreased since, it is still trading above long-term support, trying to initiate a bounce.
LTC reaches new all-time high
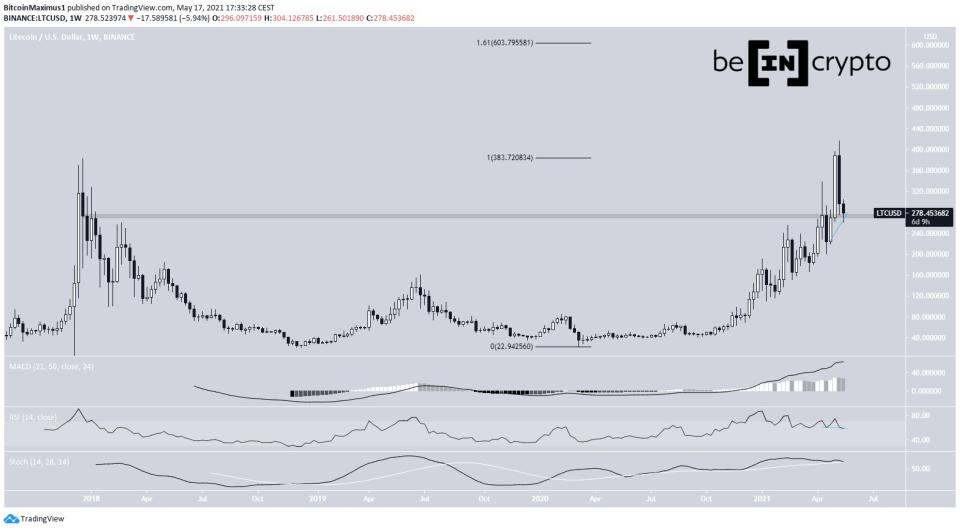
LTC has been moving upwards since the beginning of the year. It reached a new all-time high of $417 on May 10.
However, the higher prices could not be sustained. The token was rejected and has been decreasing since. Currently, it is trading just above the $270 area.
The area is likely to act as support, since it has twice acted as resistance previously, most recently on April 12.
Despite the drop, technical indicators are still bullish. Both the MACD and Stochastic Oscillator are positive. In addition, the RSI has generated hidden bullish divergence, a strong sign of trend continuation.
If the price bounces, the closest resistance area is found at $383, near the current all-time high. Afterwards, a breakout could take it all the way to $603.
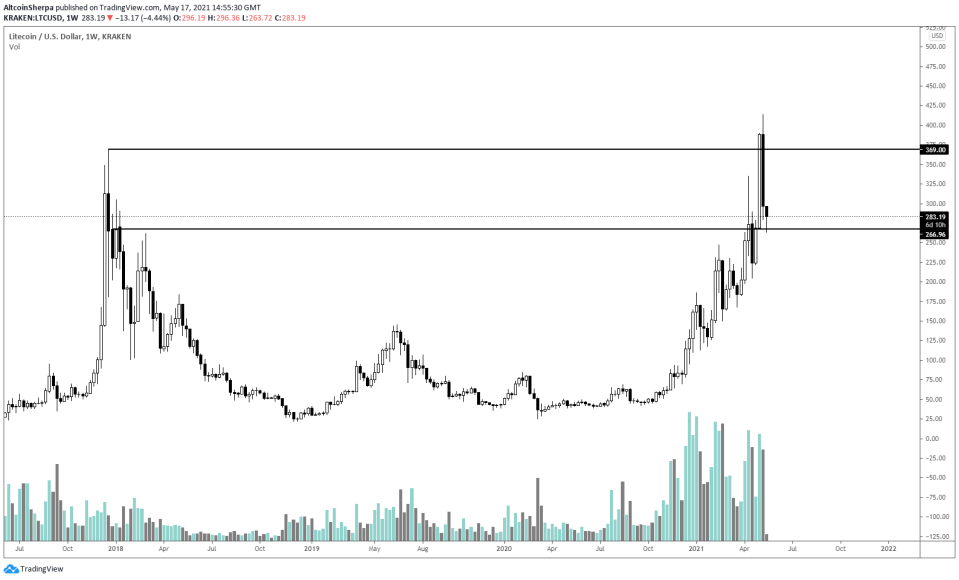
Cryptocurrency trader @altcoinsherpa noted that despite the drop, LTC is still trading above a long-term support level at $270. The support area aligns with that which we have outlined.
Daily chart shows weakness
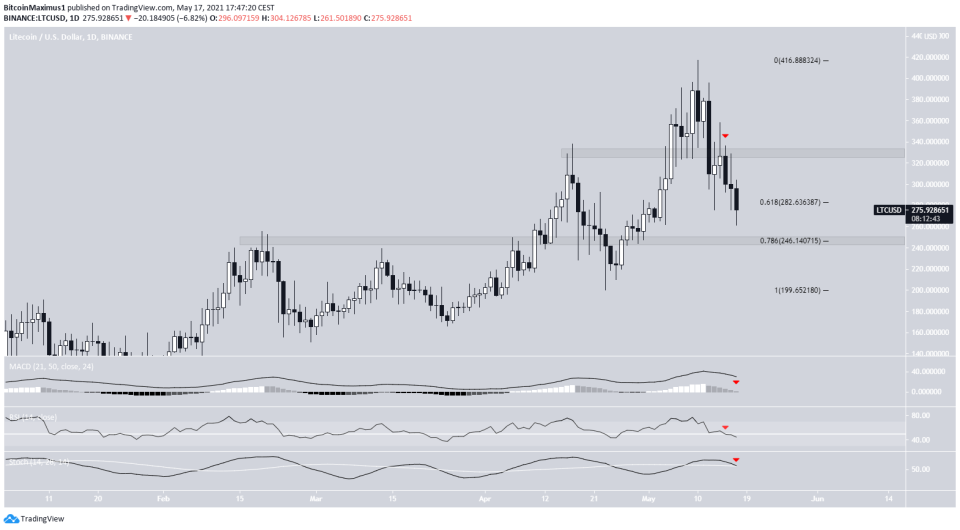
The daily chart is more bearish. Throughout the decrease, the price has fallen below the $330 area, which was supposed to act as support. To the contrary, it has now validated it as resistance (red arrow).
Furthermore, it has failed to bounce at the 0.618 Fib retracement support level at $282.
The main support area is found at $246. It is both a horizontal support area and the 0.786 Fib retracement level of the most recent upward movement.
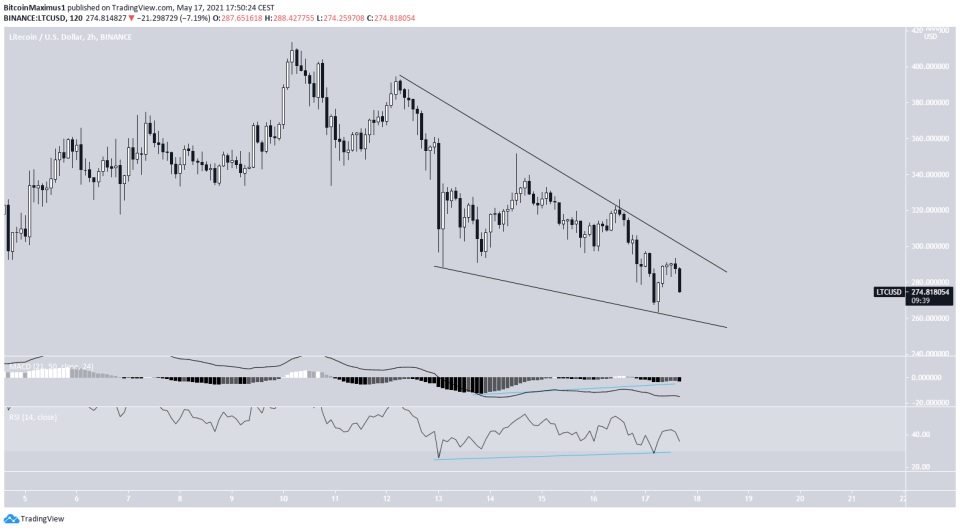
Finally, the shorter-term two-hour chart is also bullish.
Firstly, it shows a descending wedge, which is considered a bullish reversal pattern. Secondly, both the RSI and MACD have generated significant bullish divergence.
Therefore, while the token could continue consolidating inside the wedge, potentially reaching the $246 support area, an eventual breakout is expected.
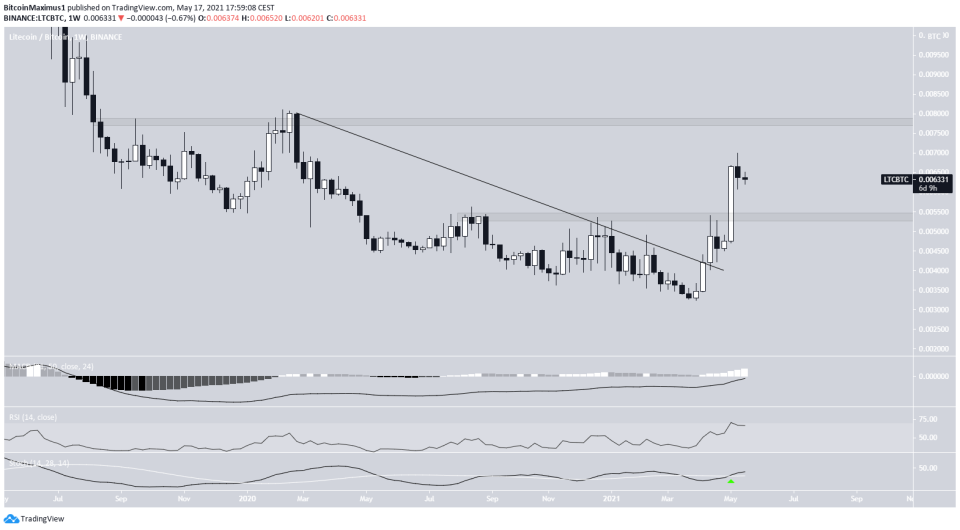
LTC/BTC
Unlike the USD pair, which is showing mixed signs, the LTC/BTC trend is decisively bullish. The price has broken out from a descending resistance line, and reclaimed the ₿0.0053 resistance area afterwards.
Technical indicators are bullish. This is especially evident by the bullish cross in the Stochastic Oscillator (green arrow) and potential RSI movement above 70.
The next closest resistance area is found at ₿0.0078.
To conclude, while LTC is expected to break out from its short-term pattern, the direction of the long-term trend is still unclear.
For BeInCrypto’s latest bitcoin (BTC) analysis, click here.
