King tides are coming back to SLO County. Here’s what to expect
Gravitational forces caused by the moon and sun create our timeless tides.
That tugging produces a tidal bulge, or, area of higher sea level on the ocean’s surface.
As the Earth rotates eastward on its axis, California moves into this bulge, which produces a flood tide and, eventually, a high tide.
As the Earth continues to spin, we move into an area of below-normal sea level, or nodes, which produces an ebb tide, eventually reaching low tide. The so-called “slack tide” is when the sea is not coming in nor going out.
By the way, these tidal forces are not the total gravitational forces exerted by the sun and moon on Earth, but the difference between these gravitational forces over the planet’s surface, according to Ray Weymann, retired director and chair of the Astronomy Department at the University of Arizona.
Starting in the first week of December, California will see the phenomenon of king tides along the coast.
King tides are some of the highest and lowest of the year, separated by less than 12 hours.
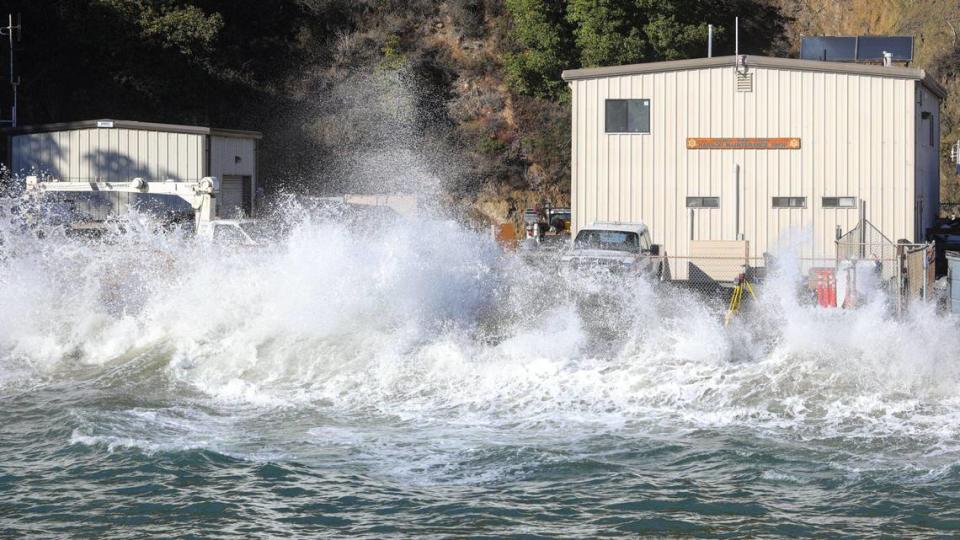
On Saturday, at 8:54 a.m., the high tide is predicted to reach 7 feet at the Port San Luis tide gauge near Avila Beach. This is one of the highest predicted tides at that San Luis Obispo County spot since Jan. 10, 2005.
However, there can be a big difference between predicted and actual sea levels when the sea is not at rest or when seawater temperatures are warmer or cooler than usual.
On Jan. 10, 2005, verified sea level hit 7.7 feet, or 0.7 feet above the expected level.
On Jan. 27, 1983, the predicted tide was 6.8 feet, but the verified sea level reached 8 feet, the highest ever seen along the Central Coast.

If you go the coastline on Saturday morning to observe the 7-foot-high tide, try to imagine if it was one foot higher, like it was in January 1983.
So why can the verified sea level be so much higher than the predicted height?
In 2015, one of the strongest El Niño events on record was brewing in the Pacific Ocean. Combined with global warming, it contributed to some of the warmest seawater temperatures ever recorded.
Usually, seawater temperatures along the Central Coast average around 58 degrees Fahrenheit in November. But that month in 2015, the temperature averaged nearly 62 degrees.
When the water warms, it causes thermal expansion in the upper levels of the ocean. Consequently, seawater levels can be several inches higher than those predicted in the tide tables.
In fact, the observed water level that month in 2015 was about 6 inches higher than predicted tides at Port San Luis.
When the water warms, it causes thermal expansion in the upper levels of the ocean. Consequently, seawater levels can be several inches higher than those predicted in the tide tables.
Other factors such as storm surge, which occurs when the winds blow across the ocean’s surface toward the coastline, can also increase tides. If winds are powerful enough, they can push and pile water on the beaches and raise sea level many feet — or decrease it many feet if the winds blow out to sea.
Another factor is atmospheric pressure.
In January 2017, air pressure readings reached 1,033.9 millibars, or 30.53 inches of mercury, or inHg, at the San Luis Obispo County Regional Airport and 1,035.6 mb 30.58 inHg, at the Paso Robles Airport.
Those readings were some of the highest I’ve ever seen.
The higher-than-average weight of the atmosphere produced lower-than-expected tide levels. The higher pressure pushed down the water surface.
On Jan. 27, 2017, the predicted tide level was negative 0.7 feet, but the actual level was negative 1.1 feet due to the higher pressure.
Lower atmospheric pressure — for example, during storms — can produce higher sea levels.
Also, storm runoff from flooded creeks and rivers that flow into estuaries and bays and high wind- generated waves can also create higher-than-predicted sea levels.
Still another factor is climate change.
“Global warming is driving actual tides to be higher than predicted on the tide charts, as warming waters and melting ice sheets on Greenland and Antarctica raise sea levels across the planet,” said Josh Willis, a NASA oceanographer and climate scientist.
PG&E brought together a team of atmospheric scientists, oceanographers and meteorologists.
Their consensus is that the sea level will rise around 7 inches along the California coastline by 2030 and nearly a foot by 2040.
By 2100 the sea levels are projected to be more than 3 feet higher along the California coastline than today.
Storm events can bring all these factors together.
King tides, warmer seawater, storm surge, low pressure and storm runoff combined with high swell can produce much higher water levels than expected.
Due to heavy rain, low air pressure, high southerly seas and gale-force southerly winds, the verified sea level hit 7.7 feet on Jan. 10, 2005, in fact, from Dec. 26, 2004, through Jan. 12, 2005, 13 inches of rain was recorded at the Diablo Canyon Power Plant rain gauge.
In the winter of 1983, one of the strongest El Niño events in California history was in full swing with 60-plus-degree seawater temperatures.
An intense storm moved in from the west in late January 1983 and produced gale-force southerly winds, heavy rain, and 20-foot high, long-period southwesterly swell trains.
All these conditions come together, like the so-called “perfect storm” on Jan. 27, 1983, when the predicted 6.8-foot tide reached a sea level of 8 feet at Port San Luis.
About a month later, the waves crashing on the shore felt like the rumbling from the footsteps of giants walking across the Pacific Ocean on March 1, 1983.
People in Avila Beach felt their homes shake with each set of gigantic waves that crashed on their beach with fearsome power. This swell event destroyed the 2,700-foot-long wooden Unocal Pier in Port San Luis.

