Johns Lyng Group (ASX:JLG) sheds 11% this week, as yearly returns fall more in line with earnings growth
It hasn't been the best quarter for Johns Lyng Group Limited (ASX:JLG) shareholders, since the share price has fallen 18% in that time. But in three years the returns have been great. The share price marched upwards over that time, and is now 226% higher than it was. After a run like that some may not be surprised to see prices moderate. Only time will tell if there is still too much optimism currently reflected in the share price.
While this past week has detracted from the company's three-year return, let's look at the recent trends of the underlying business and see if the gains have been in alignment.
View our latest analysis for Johns Lyng Group
There is no denying that markets are sometimes efficient, but prices do not always reflect underlying business performance. By comparing earnings per share (EPS) and share price changes over time, we can get a feel for how investor attitudes to a company have morphed over time.
Johns Lyng Group was able to grow its EPS at 17% per year over three years, sending the share price higher. This EPS growth is lower than the 48% average annual increase in the share price. This suggests that, as the business progressed over the last few years, it gained the confidence of market participants. It's not unusual to see the market 're-rate' a stock, after a few years of growth. This favorable sentiment is reflected in its (fairly optimistic) P/E ratio of 61.91.
The image below shows how EPS has tracked over time (if you click on the image you can see greater detail).
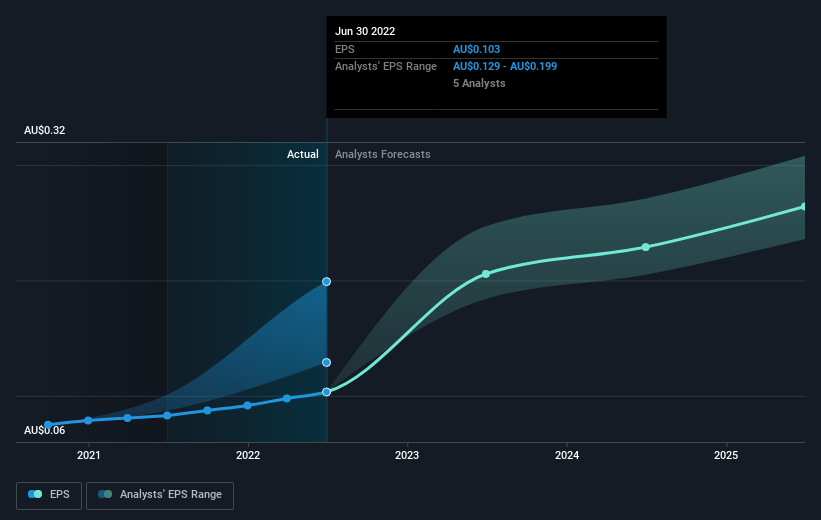
We like that insiders have been buying shares in the last twelve months. Even so, future earnings will be far more important to whether current shareholders make money. It might be well worthwhile taking a look at our free report on Johns Lyng Group's earnings, revenue and cash flow.
What About Dividends?
As well as measuring the share price return, investors should also consider the total shareholder return (TSR). Whereas the share price return only reflects the change in the share price, the TSR includes the value of dividends (assuming they were reinvested) and the benefit of any discounted capital raising or spin-off. So for companies that pay a generous dividend, the TSR is often a lot higher than the share price return. In the case of Johns Lyng Group, it has a TSR of 238% for the last 3 years. That exceeds its share price return that we previously mentioned. This is largely a result of its dividend payments!
A Different Perspective
Johns Lyng Group shareholders may not have made money over the last year, but their total loss of 3.3% ( including dividends) isn't as bad as the market loss of around 3.3%. Shareholders who have held for three years might be relatively sanguine about the recent weakness, given they have made 50% per year for three years. Given the three year returns are better than the return over the last year, it might be that the broader market has weighed on the stock recently. I find it very interesting to look at share price over the long term as a proxy for business performance. But to truly gain insight, we need to consider other information, too. For example, we've discovered 1 warning sign for Johns Lyng Group that you should be aware of before investing here.
There are plenty of other companies that have insiders buying up shares. You probably do not want to miss this free list of growing companies that insiders are buying.
Please note, the market returns quoted in this article reflect the market weighted average returns of stocks that currently trade on AU exchanges.
Have feedback on this article? Concerned about the content? Get in touch with us directly. Alternatively, email editorial-team (at) simplywallst.com.
This article by Simply Wall St is general in nature. We provide commentary based on historical data and analyst forecasts only using an unbiased methodology and our articles are not intended to be financial advice. It does not constitute a recommendation to buy or sell any stock, and does not take account of your objectives, or your financial situation. We aim to bring you long-term focused analysis driven by fundamental data. Note that our analysis may not factor in the latest price-sensitive company announcements or qualitative material. Simply Wall St has no position in any stocks mentioned.
Join A Paid User Research Session
You’ll receive a US$30 Amazon Gift card for 1 hour of your time while helping us build better investing tools for the individual investors like yourself. Sign up here
