Investors in Sanderson Design Group (LON:SDG) have unfortunately lost 29% over the last year
While it may not be enough for some shareholders, we think it is good to see the Sanderson Design Group plc (LON:SDG) share price up 18% in a single quarter. But that is minimal compensation for the share price under-performance over the last year. After all, the share price is down 31% in the last year, significantly under-performing the market.
Now let's have a look at the company's fundamentals, and see if the long term shareholder return has matched the performance of the underlying business.
Check out our latest analysis for Sanderson Design Group
To quote Buffett, 'Ships will sail around the world but the Flat Earth Society will flourish. There will continue to be wide discrepancies between price and value in the marketplace...' One flawed but reasonable way to assess how sentiment around a company has changed is to compare the earnings per share (EPS) with the share price.
Unhappily, Sanderson Design Group had to report a 2.5% decline in EPS over the last year. This reduction in EPS is not as bad as the 31% share price fall. So it seems the market was too confident about the business, a year ago. The less favorable sentiment is reflected in its current P/E ratio of 10.10.
You can see how EPS has changed over time in the image below (click on the chart to see the exact values).
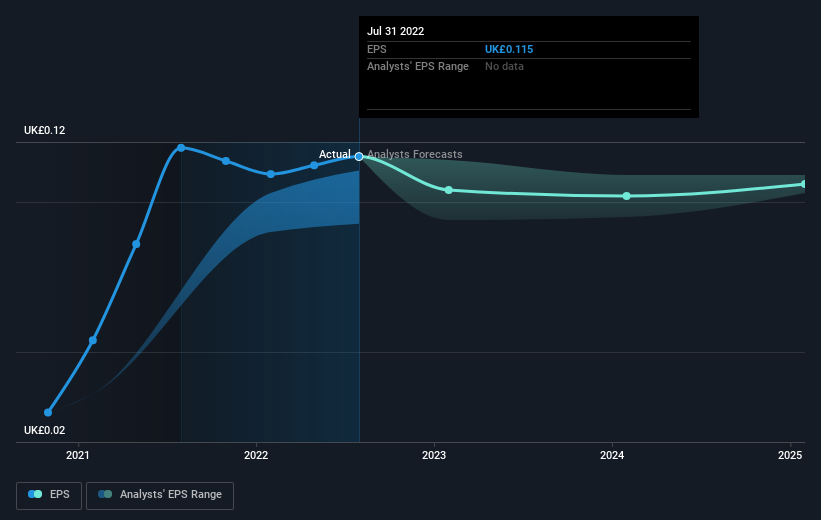
Dive deeper into Sanderson Design Group's key metrics by checking this interactive graph of Sanderson Design Group's earnings, revenue and cash flow.
What About Dividends?
It is important to consider the total shareholder return, as well as the share price return, for any given stock. The TSR is a return calculation that accounts for the value of cash dividends (assuming that any dividend received was reinvested) and the calculated value of any discounted capital raisings and spin-offs. So for companies that pay a generous dividend, the TSR is often a lot higher than the share price return. As it happens, Sanderson Design Group's TSR for the last 1 year was -29%, which exceeds the share price return mentioned earlier. And there's no prize for guessing that the dividend payments largely explain the divergence!
A Different Perspective
While the broader market lost about 6.2% in the twelve months, Sanderson Design Group shareholders did even worse, losing 29% (even including dividends). Having said that, it's inevitable that some stocks will be oversold in a falling market. The key is to keep your eyes on the fundamental developments. Regrettably, last year's performance caps off a bad run, with the shareholders facing a total loss of 1.3% per year over five years. Generally speaking long term share price weakness can be a bad sign, though contrarian investors might want to research the stock in hope of a turnaround. It's always interesting to track share price performance over the longer term. But to understand Sanderson Design Group better, we need to consider many other factors. Even so, be aware that Sanderson Design Group is showing 2 warning signs in our investment analysis , you should know about...
For those who like to find winning investments this free list of growing companies with recent insider purchasing, could be just the ticket.
Please note, the market returns quoted in this article reflect the market weighted average returns of stocks that currently trade on GB exchanges.
Have feedback on this article? Concerned about the content? Get in touch with us directly. Alternatively, email editorial-team (at) simplywallst.com.
This article by Simply Wall St is general in nature. We provide commentary based on historical data and analyst forecasts only using an unbiased methodology and our articles are not intended to be financial advice. It does not constitute a recommendation to buy or sell any stock, and does not take account of your objectives, or your financial situation. We aim to bring you long-term focused analysis driven by fundamental data. Note that our analysis may not factor in the latest price-sensitive company announcements or qualitative material. Simply Wall St has no position in any stocks mentioned.
Join A Paid User Research Session
You’ll receive a US$30 Amazon Gift card for 1 hour of your time while helping us build better investing tools for the individual investors like yourself. Sign up here

