How to pinpoint which closers are most trustworthy in your fantasy baseball drafts
Nothing drives fantasy managers crazy to the same degree as closers do. Between the small sample sizes, sporadic opportunities, and whims of team managers, closers are a constant source of frustration for even the most successful fantasy players.
But is the saves category really the most volatile one? In some ways, no.
After learning last week that elite sluggers suffer an average year-over-year drop of 10 homers and the best speedsters lose an average of 14 swipes after a dominant season, we could expect successful stoppers to suffer an even larger drop.
But the truth is that from 2014-18, relievers who were coming off a season of at least 30 saves experienced an average drop of 11.7 saves the following year. That stat is hardly reassuring but not out of line when compared to the data for position players.
[Prep for MLB's return: Create or join a Yahoo Fantasy Baseball League]
There were 74 seasons of at least 30 saves from 2014-18 (full data can be found HERE). Well, there were actually 76 seasons, but I had to throw out a pair of Greg Holland campaigns that surrounded a missed year for Tommy John surgery. The good news is that I gleaned many useful nuggets from this large group that should make predicting future save totals a little easier.
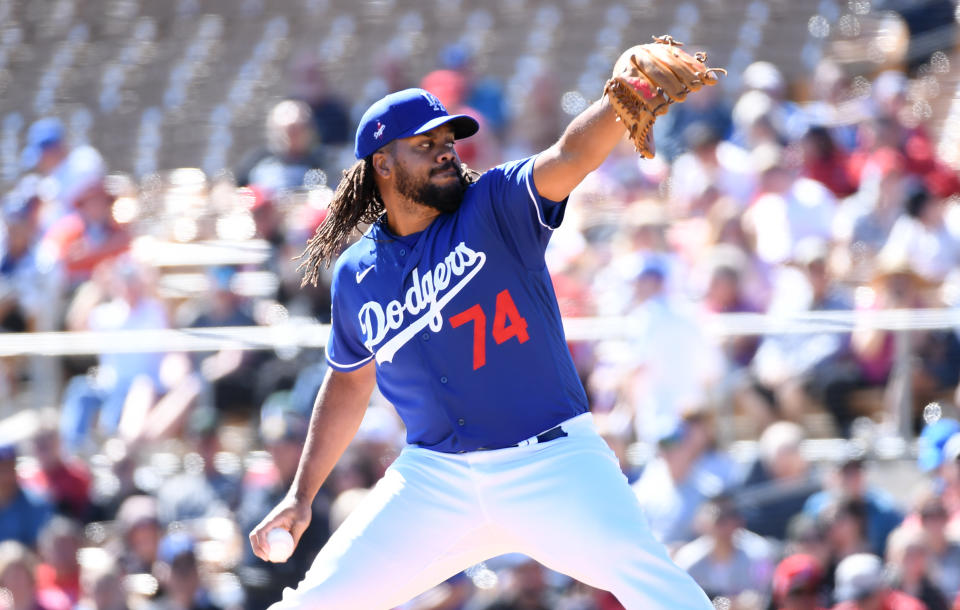
Big Three of Craig Kimbrel, Kenley Jansen, and Aroldis Chapman reign
The trio of Craig Kimbrel, Kenley Jansen, and Aroldis Chapman accounted for FOURTEEN of the 74 seasons. Their average decline was just 3.5 saves.
If we took them out of the study, the remaining 60 seasons by other relievers would have produced an average decline of 13.6 saves. That number is worse than the one I originally advertised but still within the range of those for homers and steals.

From relievers outside the Big Three, consistency from previous seasons was unfortunately not a major indicator of future performance. Closers who experienced a change of fewer than 10 saves during their 30-plus season dropped by an average of 12.1 saves the following year, while those who experienced a year-over-year change of more than 20 saves (ie. new closers), declined by an average of 14.8. A difference of just 2.7 saves is hardly enough to change our future evaluations.
Closers were also no more valuable the second time they appeared on the list. In fact, 10 relievers appeared on the list two or three years in a row before experiencing a drop of 20 or more saves in the first season in which they fell off the list.
We can easily see why managers are so afraid of being burned by closers, as one-third of the 74 cases experienced a year-over-year decline of more than 20 saves, while 20 percent logged a drop of at least 30 saves. Still, 54 percent experienced either an improvement or a drop of fewer than 10 saves. The success rate of saves sources is decent overall, but the failures are so spectacular that managers tend to remember the massive disappointment for years to come.
But what does this closer data mean?
By now you’re probably wondering when I’m going to get to the good news. Well, here it is: Skills shown during the 30-save season were a major indicator of future success.
Relievers who logged a sub-3.00 ERA the previous seasons experienced an averaged decline of 7.7 saves. Furthermore, relievers who logged a sub-2.50 ERA the previous season tallied an average decline of just 6.2 saves. Conversely, relievers who logged an ERA over 3.20 experienced an average decline of 20 saves.
Hurlers who posted a WHIP below 1.10 experienced an average decline of 6.2 saves. And those with a WHIP over 1.10 tallied an average decline of 18.3 saves.
On the most extreme end, relievers with a WHIP of 1.20 or higher logged a whopping 24.4-save decline.
[Yahoo Rankings: Overall | C | 1B | 2B | SS | 3B | OF | SP | RP]
Closers who logged a K:BB ratio of 4.0 or better experienced an average decline of 8.6 saves. And the studs with a K:BB ratio of 5.0 or higher logged an average decline of 7.3 saves, but the ones with a less-impressive K:BB ratio below 3.0 experienced an average decline of 18 saves.
As you can see, skills tell a big story in terms of closer stability. Managers should look to draft at least one closer who is coming off a season with a sub-3.00 ERA, a WHIP below 1.10, and a K:BB ratio of at least 4.0. Paying for saves makes sense, at least to some degree. A great strategy may be to pay for one saves source and then steer into the volatility of the category by using late-round picks and waivers/FAAB to get the rest of the job done.
For those who still have more drafts to come in 2020, the hurlers who currently have a ninth-inning gig and met the desired thresholds last season are: Kirby Yates, Roberto Osuna, Josh Hader, and Taylor Rogers. And if we hold firm on our ratios criteria but expand to those who currently have a closer’s role and amassed at least 20 saves in 2019, we can add Liam Hendricks, Ken Giles, and Hansel Robles to that group.


