What to Make of Falling Oil Prices, Rising Energy Stocks
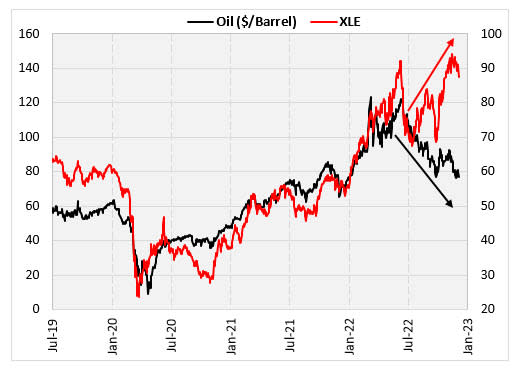
Multiple articles are coming out on the divergence between oil stocks and the price of oil. The chart below shows why it’s being talked about -- the price of oil has been falling over the past several months, while energy stocks, as represented by the Energy Select Sector SPDR (XLE), are up near multi-year highs.
This would seem like a good time to buy oil and short the oil stocks, which is a bet that the prices normalize relative to each other. In the analysis below, I will look at how these assets behaved in the past when energy stocks outpaced oil by such extreme amounts.
Energy Stocks Outperforming Oil Prices
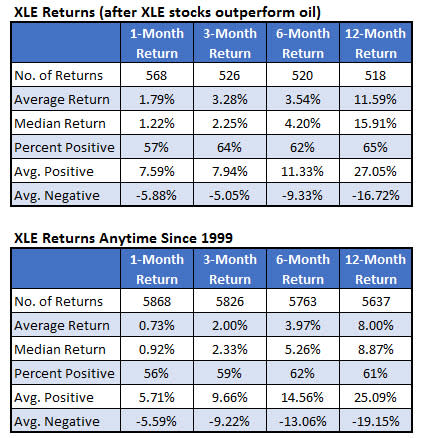
I went back to 1999 and calculated the three-month relative strength of the XLE to the spot price of oil daily. Over the last three months, oil has shed about 7%, while the XLE has gained around 12%. These are big moves in opposite directions, putting the relative strength in the 92nd percentile of readings. The table below shows how the XLE, which is a proxy for energy stocks, performed after relative strength readings were in the 90th percentile.
For prices to normalize, the price of oil needs to rise, or oil stocks need to fall. Per the data below, past instances do not show oil prices falling, with returns looking relatively normal. Six-month returns after relative strength readings in the 90th percentile show average gains of 3.54%, with 62% of the returns positive.
Since 1999, the XLE typically gained 3.97%, with 62% of the returns positive. A year after these instances, oil tended to do better than normal oil returns (11.59% vs. 8%).
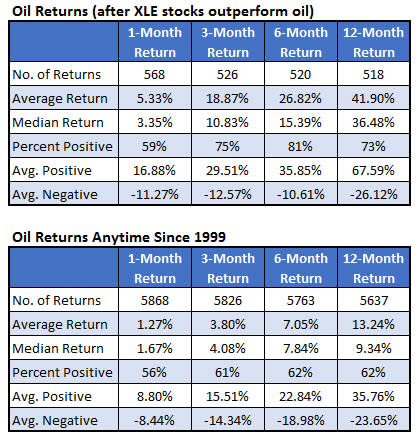
If oil stocks don't fall, then oil prices must rise for prices to get back to normal. The table below shows that’s what usually happened. After oil stocks outperform on a three-month basis, oil tends to make it up going forward.
Six months after these instances of XLE outperformance, oil averages a return of more than 26% over the next six months, with 81% of the returns positive. Oil normally gains around 7% over six months with 62% of the returns positive. A year later, oil gained an average of 42%, compared to a typical return of 13% for oil.
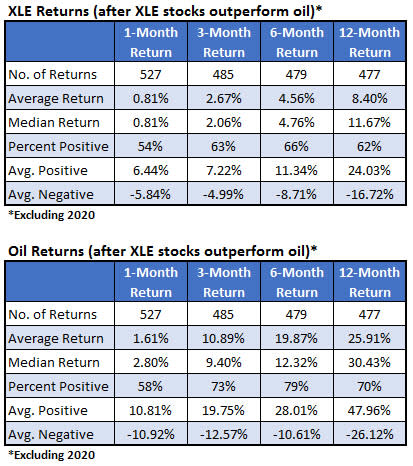
I noticed a good portion of signals occurred in 2020, and wondered if the conclusions would change if we got rid of those signals. The first table shows XLE performance after these signals, excluding those from 2020. The second table shows the same data for oil.
The conclusion is the same, with nothing special about XLE returns. Oil returns are less extreme when you eliminate 2020 signals, but are still impressive and greatly outperform normal oil returns.