How the Dow Performs After Crossing These Key Intervals
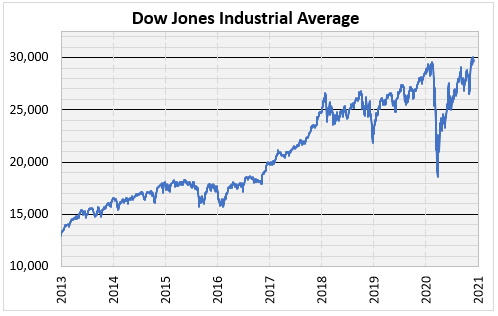
Even levels on popular indexes make for an interesting conversation. Psychologically, they are often markers at which the index is deemed expensive or cheap. This can make them popular points to take profits or purchase shares. The Dow Jones Industrial Average (DJI) hit 30,000 last week for the first time ever, obviously a major newsworthy event. This week I will show you how the Dow has performed in the past after crossing these even 1,000-point levels. Additionally, this is not just another even 1,000-point interval level, it is a ten-millennium level.
Running Into 1,000 Point Intervals
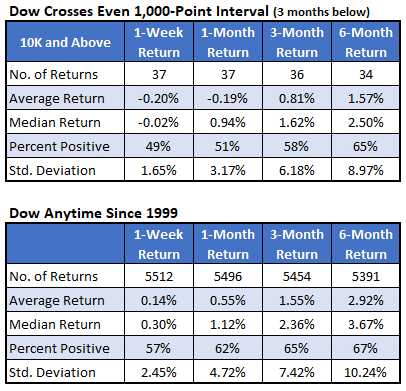
The table below shows how the Dow has performed after hitting a 1,000-point interval level of 10,000 or more. The index first reached 10,000 in 1999 so I have the typical returns since then in the second table below for comparison. For a signal, the index had to be below the level for at least three months before crossing it on an intra-day basis. The returns after a signal are not as good as typical market returns across all the time frames but especially immediately after its cross. This supports the notion that these even levels are significant points of resistance in the short term. This does not bode well for the Dow over the next few months.

Even Levels & Investor Sentiment
One gauge of investor sentiment is the Investors Intelligence (II) weekly sentiment poll. It is a compilation of investor newsletters and emails which the editors at Investors Intelligence gather, and then determine the percentage that are bullish, bearish or predicting a correction. In its latest release, it showed about 65% of newsletters were bullish on stocks. That is the highest reading in almost three years. I was curious if there was any difference in how stocks behaved around these levels given the level of optimism.
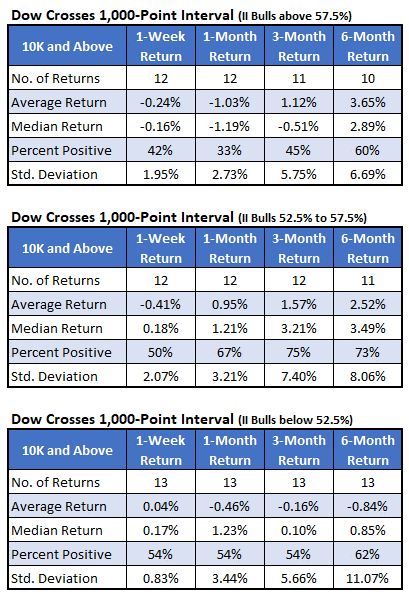
I separated the returns of the Dow after crossing even levels based on the percentage of bulls in the II weekly survey. I grouped them by whether the percentage of bulls in the poll was over 57.5%, below 52.5% or somewhere in between. This made the groups have roughly the same number of returns. When you look at the summary of the returns below you see stocks really struggled in the immediate short-term when investors were most bullish. That first table shows a month after crossing these even levels, The Dow averaged a loss of 1% with only a third of the returns positive. The longer-term returns, in these situations, is different. The Dow averages a more respectable return when you get to three and six months later. Interestingly, the industrials struggle across all time frames when investor sentiment is most bearish (see the returns in the bottom table) averaging a negative return even out to six months. One theory is that a combination of a squeamish investor class and a prevalent stock index running into a popular level for profit-taking is a recipe for underperformance.
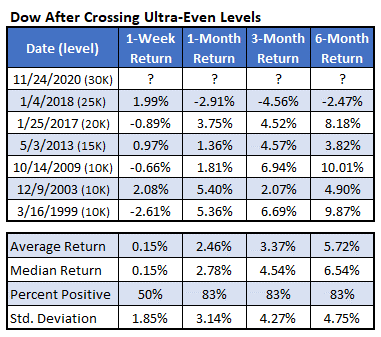
An Ultra-Even Level
I mentioned earlier that 30,000 seems more significant than other intervals. The table below shows each time the Dow signaled running into 10-, 15-, 20-, and 25,000. I also summarize the returns. It’s good news that, other than the 25,000 level, the Dow hasn’t struggled much after these ultra-even levels. Maybe instead of profit-taking points, these round levels are wake up calls to investors and act as capitulation points for reluctant buyers. Hopefully “Dow 30-Thousand” has a nice ring and brings in the buyers.