Don't Sweat the S&P 500's Pullback to This Key Trendline
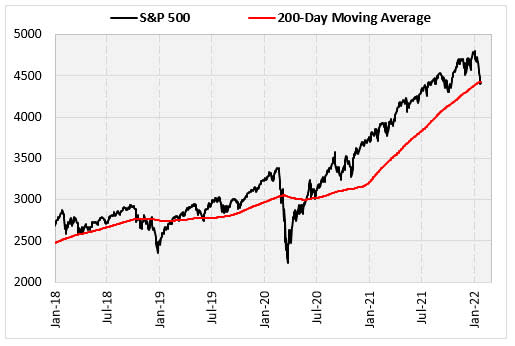
Stocks are pulling back, and investors are jittery. Plus, the S&P 500 Index (SPX) broke below its 200-day moving average for the first time in more than 12 months. In fact, the last time this happened was at the beginning of the Covid-19 pandemic, and it led to some steep losses. The American Association of Individual Investors’ (AAII) sentiment survey was already showing some anxiety before this recent break, but is their concern warranted?
To answer that question, I will be looking at prior breaks below the 200-day moving average over the years to see how stocks performed moving forward. Then, I'll also layer in some of the AAII sentiment data to see if that has any effect on the implications.
Prior Breaks Below the 200-Day Moving Average
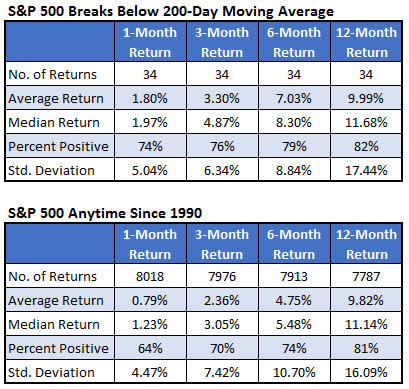
Since 1990, the SPX broke below its 200-day trendline 34 times, after standing above it for at least 20 days prior. The table below summarizes how the index performed after those instances. The second table shows typical returns since 1990, for reference.
Based on this data, a break below this moving average is not a reason for concern. In fact, this level has commonly served a bounce-back spot for the market. In the month after the break, the index averaged an 1.8% gain, with 74% of the returns positive.
Typically, the SPX gained an average of 0.79%, with 64% of returns positive. Three months after a signal, the S&P 5oo outperforms the average anytime return with a 7.03% gain, as opposed to 4.75%. The one-year returns after a signal look practically identical to the anytime returns.
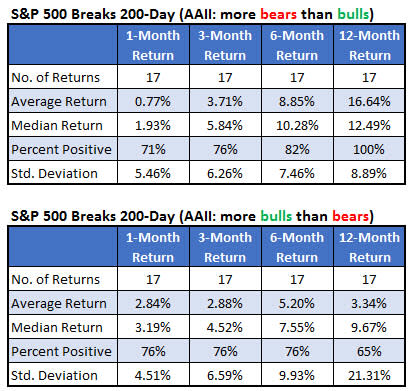
I mentioned earlier that per the AAII sentiment survey, investors were already nervous about the direction of the stock market. The latest survey shows more bears than bulls (47% vs. 21%). The first table below shows our current situation, when the SPX breaks below its 200-day moving average, while the AAII survey is showing more bears than bulls.
There was underperformance in the short one-month returns after these occurrences. After that, the returns outperform in this situation, even more so for longer-term returns. After six months, when the AAII was leaning bearish, the SPX averaged a 8.85% gain, with 82% of returns positive.
Compare this to 5.2% average six-month return, with 76% of returns positive, when there were more bulls than bears. The one-year returns are especially impressive when a break occurred while bears were in control. A year after such an occurrence, the index gained on average 16.6%, with all 17 returns positive.
Finally, I separated the returns when the percentage of bears was at least 10% higher than the bulls, which is our current situation. In these instances, you get bullish returns not only in the longer term, but also at that very short one-month timeframe.
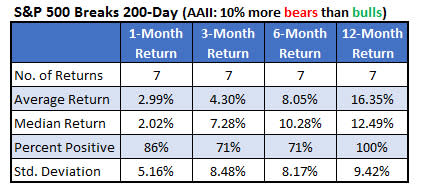
Based on the analysis above, a break below the 200-day moving average, by itself, is not something investors should fear. This is especially true when investors were already anxious, as measured by the percentage of bears and bulls in the AAII sentiment survey.
