What Does CAI's Recovery Say About the Economy?
- By Robert Abbott
CAI International Inc. (NYSE:CAI) is a container company that leases those ubiquitous metal boxes. As such, it is something of a harbinger of future economic activity because almost everything manufactured moves in them. Products cannot be sold in stores, on lots or elsewhere until they have been transported from manufacturing sites.
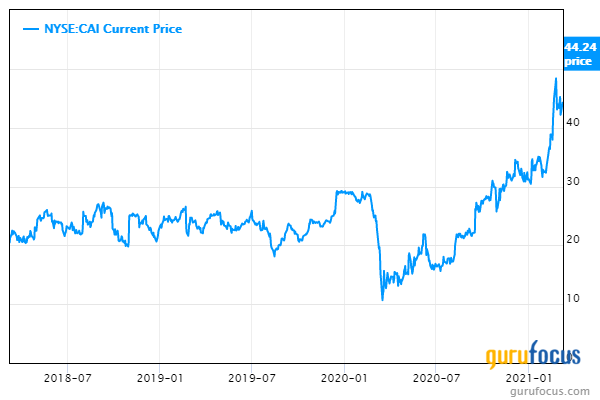
So does the CAI share price suggest a recovery is in the making? If this three-year chart provides an indication, yes, we are headed for better economic times:
About CAI
CAI is a transportation finance company based in San Francisco. It leases equipment, mainly intermodal shipping containers to its customers. In addition, it manages equipment for third-party investors. It leases, re-leases and disposes of equipment no longer wanted or needed.
It is one of the world's larger operators; at the close of business on Dec. 31, it owned or managed a fleet of 1,744,649 containers, up from 1,681,177 at the end of 2019. These numbers are reported in TEUs, 20-foot equivalent units, the standard measure used by the intermodal marine container industry.
Of those 1,744,649 containers, approximately 97% are owned and about 3% are managed.
One of the key metrics for business success in the industry is the utilization rate, and CAI's rate in 2020 was 98.5%, just a tenth of a point below the utilization rate in 2019.
During 2020, the company continued to narrow its focus. That involved selling its logistics business to the NFI Group (NFI) in August for $6.2 million. And at year's end, it sold its remaining railcar fleet to affiliates of Infinity Transportation for $228.1 million. These deals return it to its roots as a pure-play container business and provided cash for other purposes.
There are three main types of leases: long-term leases of one year or more; short-term leases of less than one year (with higher daily rates); and financial leases in which CAI funds lessees, who typically become owners at the ends of the leases. CAI's fleet comprises:
Long-term leases: 68%
Short-term leases: 8%
Financial leases: 24%
Risks
CAI's business is relatively concentrated on a small number of customers. The 10 largest customers made up 62.5% of its billings in 2020. They included MSC Mediterranean Shipping Company S.A. and CMA CGM, which accounted for 17.1% and 10.2%.
Like much of the rest of the transportation industry, the demand for containers fluctuates with economic conditions and world trade. These risks were highlighted recently; in the second half of 2019 and the first half of 2020 by trade disagreements between the United States and China. The first half of 2020 was also affected by the Covid-19 pandemic and associated lockdowns.
In its 10-K for 2020, the company noted its "utilization, average leasing rates and used container prices decreased steadily throughout 2019 and the first half of 2020, and our profitability decreased as well."
Competition
There are several types of competitors:
Other global container leasing companies, some bigger and some smaller.
Bank leasing companies that offer the same types of leases.
Container manufacturers that decide to enter the leasing business.
Other major container companies include TRITON International (NYSE:TRTN), Florens Container Leasing, Textainer Group (NYSE:TGH), Seaco Global and Seacube Containers (FRA:03S).
Financial strength
Debt weighs heavily on this company's balance sheet:
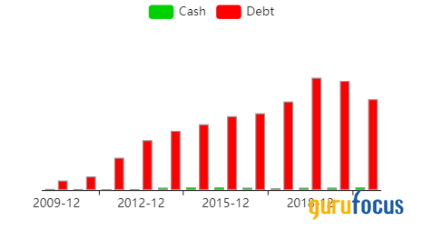
The cash-to-debt ratio is very low, at just 0.03, meaning it has only enough cash to cover 3% of its debt. The median for the business services industry is significantly higher at 0.86.
Similarly, the interest coverage ratio is low, but not so dramatically. It clocks in a 2.25, while the industry average is 11.74.
The Piotroski F-Score is 5 out of 9, which is what GuruFocus says is typical for a stable company.
The Altman Z-Score is seriously low, although we know of no push to put it out of business; it does have, after all, lenders with a significant amount of collateral.
And, based on trailing 12-month data, its weighted average cost of capital is slightly higher than its return on invested capital. WACC is 5.1%, while the ROIC is 4.82%. Presumably, that ratio will reverse if the world economy continues to recover.
Profitability
Given the declines during the second half of 2019 and the first half of 2020, we'll examine its profitability over more than a three-year period, starting with its operating and net margins:

In 2020, the company began to recover from the slump in 2019, but as the net margin shows, it has not fully recovered.
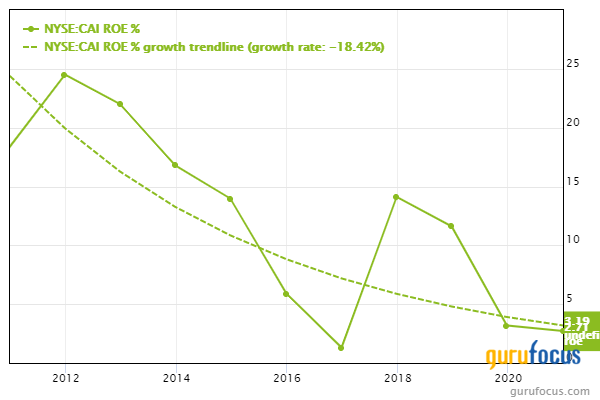
The trendline on the following chart shows how badly CAI's return on equity has slipped throughout the past decade:
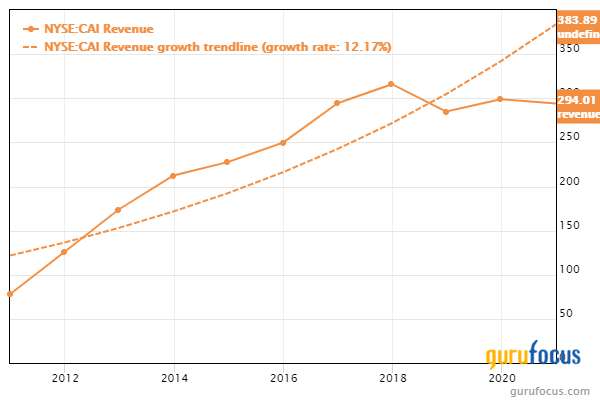
Revenue fell off significantly in 2018, and still has not recovered:
The Ebitda chart looks much like that for revenue:

There is an interesting divergence on this chart between earnings per share on the red line and earnings per share with estimate on the blue line:
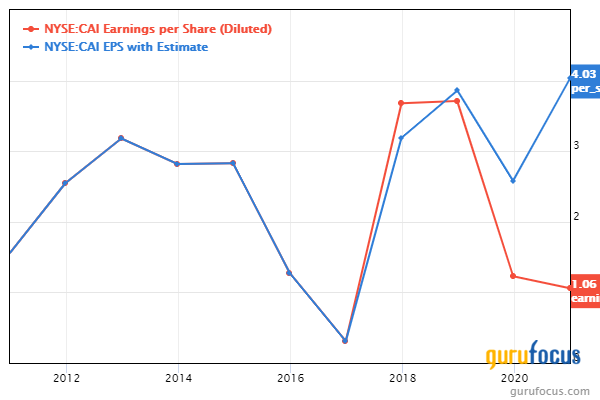
The divergence suggests analysts expect much better earnings performance this year.
Dividend and share repurchases
Apparently, management is feeling confident; last September, it paid its first quarterly dividend of 25 cents. The same was paid out in December, while the dividend slated for later this month will be 30 cents.
That bump, from 25 cents to 30 cents, accounts for the significant difference between the current dividend yield and the forward dividend yield. And with a dividend payout ratio of just 12%, the dividend is likely safe.
As for share buybacks, CAI has whittled down its shares outstanding by 21.65% since 2014:

Valuation
In recovering from the deep market plunge last spring, the CAI share price shot up like a rocket. Here is the three-year price chart again:
The GF Value chart considers CAI to be very pricey:

The price-earnings ratio is 41.95, well above the industry median of 22.44.
However, when we get to the PEG or PEPG ratio, we gain some clarity. CAI has a PEG ratio of 1.04, which is right on the fair valuation mark. To put it another way, based on price-earnings alone, this is an overvalued company, but when we consider its Ebitda growth over the past five years, it is fairly valued.
The discounted cash flow calculator, based on three-star predictability, shows CAI to be modestly overvalued or undervalued, depending on the growth value specified. In its default setting, the calculator uses an average growth rate of 5%; increasing that to a 10% growth rate produces a modest margin of safety: 6.86%
Overall, I think CAI is fairly valued or slightly overvalued.
Gurus
Management and analysts may be confident in CAI's future, but the gurus are on a different track. They've been doing more selling than buying:
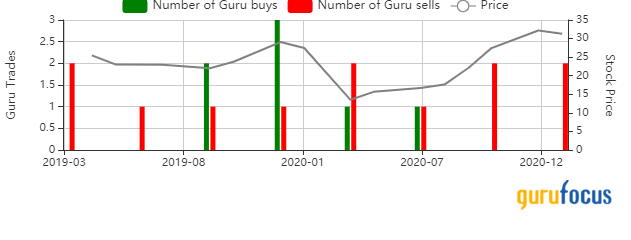
The one guru still holding shares in CAI at the end of the year was Donald Smith & Co, which reduced its holding by 40.19% to finish with 213,917 shares. That was good for a 1.21% stake in the company and represented 0.29% of its total assets.
Several prominent gurus bought and sold the stock in the fourth quarter, including Barrow, Hanley, Mewhinney & Strauss, Chuck Royce (Trades, Portfolio) of Royce Investment Partners and Jim Simons' Renaissance Technologies. Given the speed with which the share price was rising, they might have bought and took quick profits.
Conclusion
CAI International appears to be turning itself around, partly through a recovering economy and partly because of its own efforts. Assuming the world economy continues to vaccinate itself out of the pandemic, trade should increase, led by demand for containers. That expectation may have helped drive the share price so high so quickly. Still, it does not have a strong balance sheet, nor can we be sure world economies will recover as quickly as we would like.
Depending on the criteria used, it can be viewed as modestly undervalued or modestly overvalued. Given the rise since last April, I wonder how long or how far share prices can go up before they experience a serious pullback (over the past two weeks, we've seen the share price decline 14.35%).
CAI makes sense for growth investors, investors who are willing to take a chance that there's still lots of life left in the share price. Value investors will see too much debt and not enough of a margin of safety. For income investors, there are better choices for dividend income.
Disclosure: I do not own shares in any of the companies named in this article and do not expect to buy any in the next 72 hours.
Read more here:
Gurus Are Buying Trip.com as Travel Industry Shows Signs of Recovery
Rollins: Its Dividend Was Cut, but Total Returns Remain Above Average
Not a Premium Member of GuruFocus? Sign up for a free 7-day trial here.
This article first appeared on GuruFocus.