When to Buy Stocks After Black Friday
Thanksgiving week means Black Friday, the unofficial start of the holiday shopping season. After a few years of being open on Thanksgiving, many retailers will be closed this year, like last year, due to Covid-19, labor shortages, etc. Next week will be reports of foot traffic, sales, online sales and fist fights which will all be used to gauge the strength of the consumer and the economy in general. In other words, it should be a telling week for the stock market. I’m taking a look at past years to see how stocks have behaved in the coming week and if the market’s behavior is any indicator for what to expect going forward.
Week After Black Friday
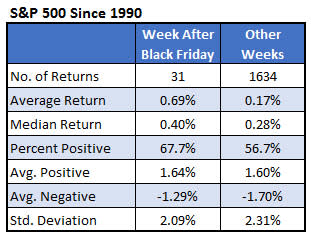
The table below summarizes the S&P 500 (SPX) performance in the week after Black Friday. Since 1990, it has been bullish averaging a gain of 0.69% per week, compared to a 0.17% gain for other weeks. Also, the percentage of returns that have been positive is higher than typical weeks (68% vs. 57%). I thought you might see a higher standard deviation during the week because of reactions to the retail shopping data but that has not been the case.
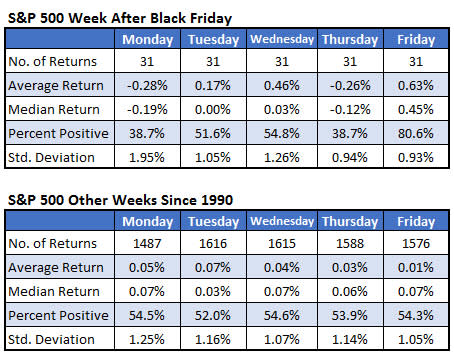
If you’re looking to profit from the seasonality, history suggests holding off until after Monday to buy stocks. The table below breaks down next week’s performance by day of the week. Cyber Monday has been a terrible day for stocks. The S&P 500 has averaged a loss of 0.28% with less than 40% of the returns positive. Additionally, Cyber Monday has been a down day for the index in nine of the past ten years.
The only day next week that has been exceptionally bullish has been Friday. It has been positive over 80% of the time averaging a gain of 0.63%. The bullish Black Friday week returns have largely been driven by just the last day of the week.
Week After Black Friday as an Indicator
With Black Friday numbers revealing so much about the economy, I was curious if the stock market reaction could be an indicator itself. The table below is interesting, suggesting next week’s price action is a trustworthy indicator. Since 1990, when the week after Black Friday has been positive, the S&P 500 gained an average of 3% over the next three months with 76% of the returns positive. Compare that to when the index was down next week. In that case, the S&P 500 loses an average of over 1% the next three months with 60% of the returns positive.
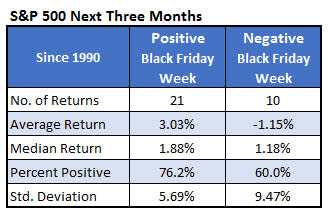
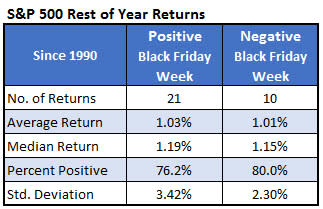
As a short-term indicator, this has not been a reliable indicator. The market has performed well no matter what. Perhaps there are end-of-year dynamics that come into play that have nothing to do with consumer strength and it drives the stock market through the end of the year (tax reasons, end-of-year portfolio adjusting, etc.). The table below is like the one above except it looks at returns through the end of the year instead of the next three months.
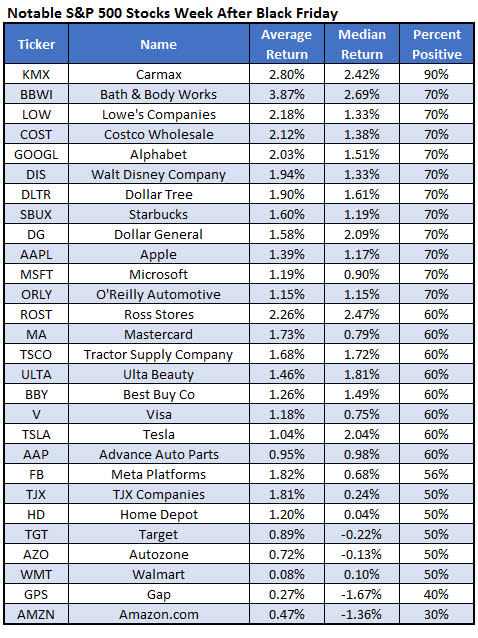
Notable Stocks Next Week
Finally, I thought it would be worthwhile to include a list of S&P 500 retailing stocks and some other noteworthy stocks and how they’ve tended to perform over the past 10 years in the week after Black Friday. At the top of the list, CarMax (KMX) has been positive nine of the past 10 years while Amazon.com (AMZN) is at the bottom and has been positive just 30% of the time. Interestingly, every one of those stocks average a positive return.