BTC Creates Higher Low and Attempts to Begin Bullish Reversal
The bitcoin (BTC) price has been decreasing at an accelerated rate since April 18.
Despite the drop, BTC has created a short-term higher low. A breakout from the current descending resistance line would confirm the bullish trend reversal.
Ongoing BTC bounce
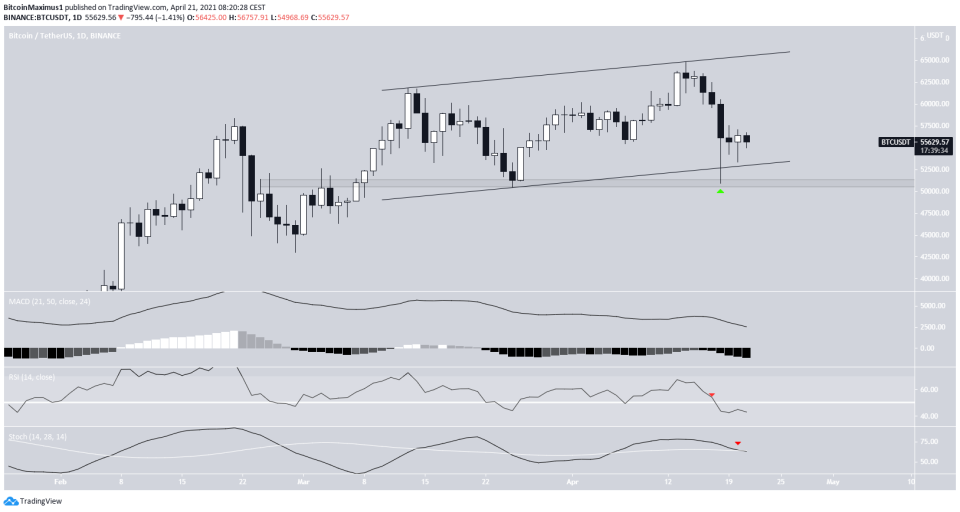
On April 18, BTC reached a low of $50,931. However, it immediately bounced, creating a very long lower wick.
Since then, it has been trading near the $55,000 level.
Despite the bounce, technical indicators in the daily time-frame are bearish. The MACD has crossed into negative territory. The RSI is trading below 50. Furthermore, the Stochastic oscillator has just made a bearish cross.
Nevertheless, the bounce has been very significant. In addition, the price is also trading above the support line of a potential ascending parallel channel. This indicates that the current movement could be a big running flat correction.
As a result, we can consider the trend bullish as long as the price is above the $51,000 area and especially the support line of the channel.
Short-term BTC movement
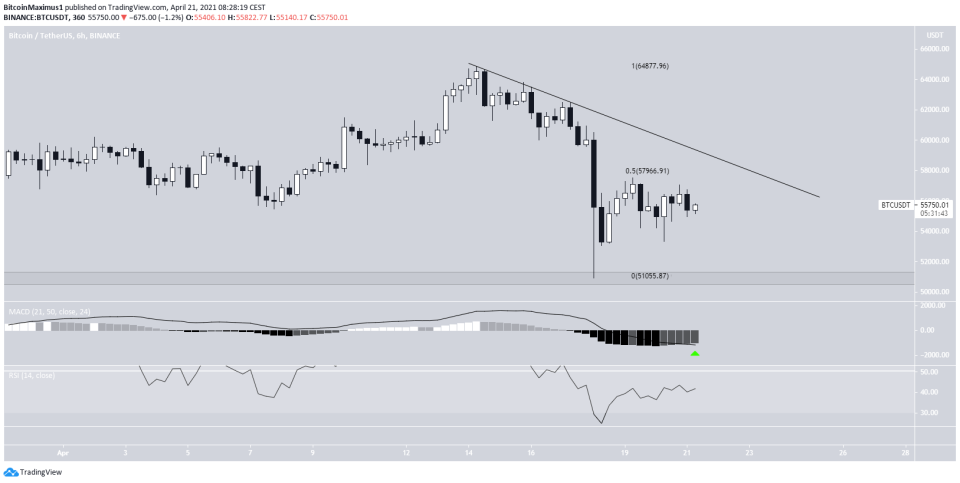
The shorter-term six-hour chart shows that BTC is also following a descending resistance line. The line currently coincides with the 0.5 Fib resistance at $57,960.
Technical indicators are already turning bullish, supporting a reversal. The MACD has given a bullish reversal signal and the RSI is increasing.
This indicates that the price is likely to head towards the resistance line and potentially break out.
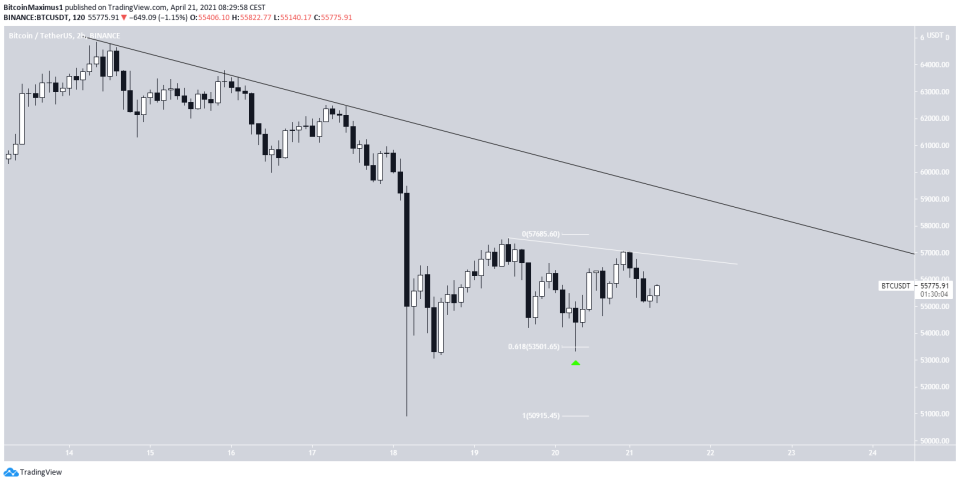
The two-hour chart is in alignment with the six-hour one.
The price has already created a higher low at the 0.618 Fib retracement support.
A breakout from the very short-term descending resistance line (white) would confirm that BTC is heading towards the longer-term resistance.
To conclude, BTC is attempting to regain its footing after the significant drop. A breakout from the current descending resistance line would confirm this.
For BeInCrypto’s previous bitcoin (BTC) analysis, click here.
