Is Braime Group PLC's (LON:BMT) Recent Price Movement Underpinned By Its Weak Fundamentals?
It is hard to get excited after looking at Braime Group's (LON:BMT) recent performance, when its stock has declined 17% over the past three months. We, however decided to study the company's financials to determine if they have got anything to do with the price decline. Long-term fundamentals are usually what drive market outcomes, so it's worth paying close attention. In this article, we decided to focus on Braime Group's ROE.
Return on equity or ROE is an important factor to be considered by a shareholder because it tells them how effectively their capital is being reinvested. In simpler terms, it measures the profitability of a company in relation to shareholder's equity.
View our latest analysis for Braime Group
How Do You Calculate Return On Equity?
The formula for ROE is:
Return on Equity = Net Profit (from continuing operations) ÷ Shareholders' Equity
So, based on the above formula, the ROE for Braime Group is:
4.8% = UK£750k ÷ UK£16m (Based on the trailing twelve months to December 2021).
The 'return' is the profit over the last twelve months. Another way to think of that is that for every £1 worth of equity, the company was able to earn £0.05 in profit.
Why Is ROE Important For Earnings Growth?
So far, we've learned that ROE is a measure of a company's profitability. We now need to evaluate how much profit the company reinvests or "retains" for future growth which then gives us an idea about the growth potential of the company. Assuming everything else remains unchanged, the higher the ROE and profit retention, the higher the growth rate of a company compared to companies that don't necessarily bear these characteristics.
Braime Group's Earnings Growth And 4.8% ROE
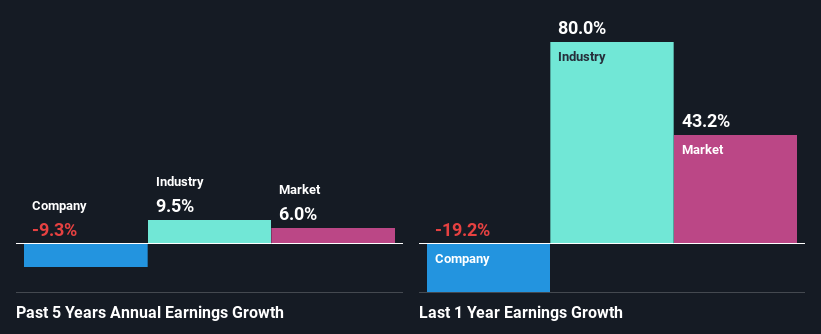
When you first look at it, Braime Group's ROE doesn't look that attractive. A quick further study shows that the company's ROE doesn't compare favorably to the industry average of 15% either. Given the circumstances, the significant decline in net income by 9.3% seen by Braime Group over the last five years is not surprising. However, there could also be other factors causing the earnings to decline. Such as - low earnings retention or poor allocation of capital.
However, when we compared Braime Group's growth with the industry we found that while the company's earnings have been shrinking, the industry has seen an earnings growth of 9.5% in the same period. This is quite worrisome.
Earnings growth is an important metric to consider when valuing a stock. What investors need to determine next is if the expected earnings growth, or the lack of it, is already built into the share price. This then helps them determine if the stock is placed for a bright or bleak future. Is Braime Group fairly valued compared to other companies? These 3 valuation measures might help you decide.
Is Braime Group Efficiently Re-investing Its Profits?
When we piece together Braime Group's low three-year median payout ratio of 15% (where it is retaining 85% of its profits), calculated for the last three-year period, we are puzzled by the lack of growth. The low payout should mean that the company is retaining most of its earnings and consequently, should see some growth. It looks like there might be some other reasons to explain the lack in that respect. For example, the business could be in decline.
Moreover, Braime Group has been paying dividends for at least ten years or more suggesting that management must have perceived that the shareholders prefer dividends over earnings growth.
Conclusion
On the whole, we feel that the performance shown by Braime Group can be open to many interpretations. While the company does have a high rate of profit retention, its low rate of return is probably hampering its earnings growth. Wrapping up, we would proceed with caution with this company and one way of doing that would be to look at the risk profile of the business. To know the 3 risks we have identified for Braime Group visit our risks dashboard for free.
Have feedback on this article? Concerned about the content? Get in touch with us directly. Alternatively, email editorial-team (at) simplywallst.com.
This article by Simply Wall St is general in nature. We provide commentary based on historical data and analyst forecasts only using an unbiased methodology and our articles are not intended to be financial advice. It does not constitute a recommendation to buy or sell any stock, and does not take account of your objectives, or your financial situation. We aim to bring you long-term focused analysis driven by fundamental data. Note that our analysis may not factor in the latest price-sensitive company announcements or qualitative material. Simply Wall St has no position in any stocks mentioned.

