Blue-Chip Bank Stock Flashes Historically Bullish Signal
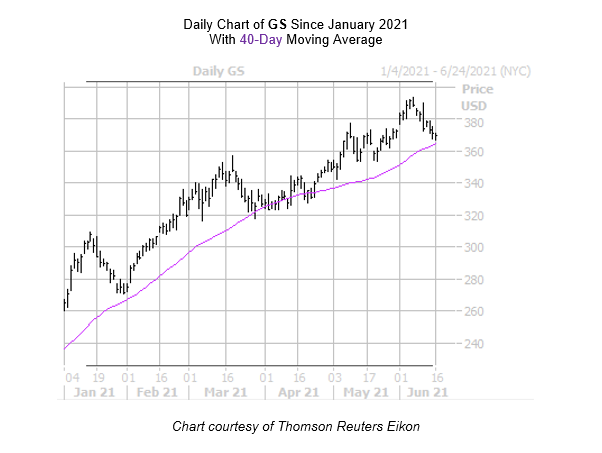
The shares of Goldman Sachs Group Inc (NYSE:GS) have been falling since their June 7 all-time high of $393.26. While down 0.4% today, last seen trading at $369.84, the shares sport an impressive 39.5% year-to-date lead. Plus, GS is flashing a historically bullish signal on the charts.
More specifically, the equity just came within one standard deviation of its ascending 40-day moving average, after spending considerable time above it. According to data from Schaeffer's Senior Quantitative Analyst Rocky White, nine similar signals have occurred in the past three years. Goldman Sachs stock enjoyed a positive return one month later in 67% of those cases, averaging a 4.2% gain. From its current perch, a comparable move would put GS above the $385 level and close to its aforementioned record peak.
Puts have been more popular than usual, too, leaving plenty of pessimism to be unwound in the options pits. This is per the security's Schaeffer's put/call open interest ratio (SOIR) of 1.72 sits in the highest percentile of its annual range, meaning short-term options traders have been more bearish than normal.
What's more, GS options can be had for a bargain at the moment. The security's Schaeffer's Volatility Index (SVI) of 26% sits in just the 10th percentile of its annual range, indicating options players are pricing in low volatility expectations right now. What's more, Goldman Sachs stock's Schaeffer's Volatility Scorecard (SVS) ranks at 80 out of 100, which implies the stock usually outperforms these volatility expectations.
