'As a Black man, I'm appalled': Report shows gap between Black, white student achievement

Black Buncombe County and Asheville City school students are significantly less likely to hit performance metrics and are more likely to be disciplined at school than their white peers, a new report by Buncombe County staff shows.
In Asheville City Schools, only 11% of Black students grades three to eight were considered proficient in math in the 2021-22 school year based on end-of-year standardized tests, compared to the 66% of white students who were considered proficient. That's a 55 percentage point gap. Similarly, only 13% of Black students in the same grades were considered proficient in reading, compared to 75% of white students, a 62 percentage point gap.
In Buncombe County Schools, the gaps were 40 percentage points in math and 36 percentage points in reading.
"As a Black man, I'm appalled at what I see when I look at the numbers," said Al Whitesides, the first African American to serve as a commissioner for Buncombe County. "Every year, the schools come before us, and every year we hear the same song. We spend over $100 million a year ... so it's not a question that Buncombe County is committed to our students.
"My concern is, 'What's happening with both school systems?'" he asked.
The report was presented Feb. 7 at a briefing before the regular Buncombe County Board of Commissioners meeting as an update on the county's Educated & Capable Community Strategic Plan Focus Area, which looks to improve educational achievement and quality of life of all age groups.
Over fiscal year 2023, Buncombe County invested over $106 million in education, the report noted. Both Buncombe County Schools Superintendent Rob Jackson and Asheville City Schools Interim Superintendent Jim Causby were present at the briefing, and though neither answered Whitesides' question, they both acknowledged the gaps that exist.
"When you're trying to raise proficiency, it's a slow process," Causby said. "There are things you can put in place to make it happen. You have to have a school board and a superintendent that demand those things and set those as priorities. You then have to inculcate that belief in the whole system. You have to constantly get people to understand and believe it."
Some progress is taking place, as Causby said that the 2021-2022 school year saw record growth in Black student achievement, the highest growth in Asheville City Schools history.
Both Causby and Whitesides noted that poverty is likely the cause of these gaps, and that although historically disadvantaged groups like Black people are more likely to be in poverty than white people, poor people across racial boundaries struggle in the public school system.
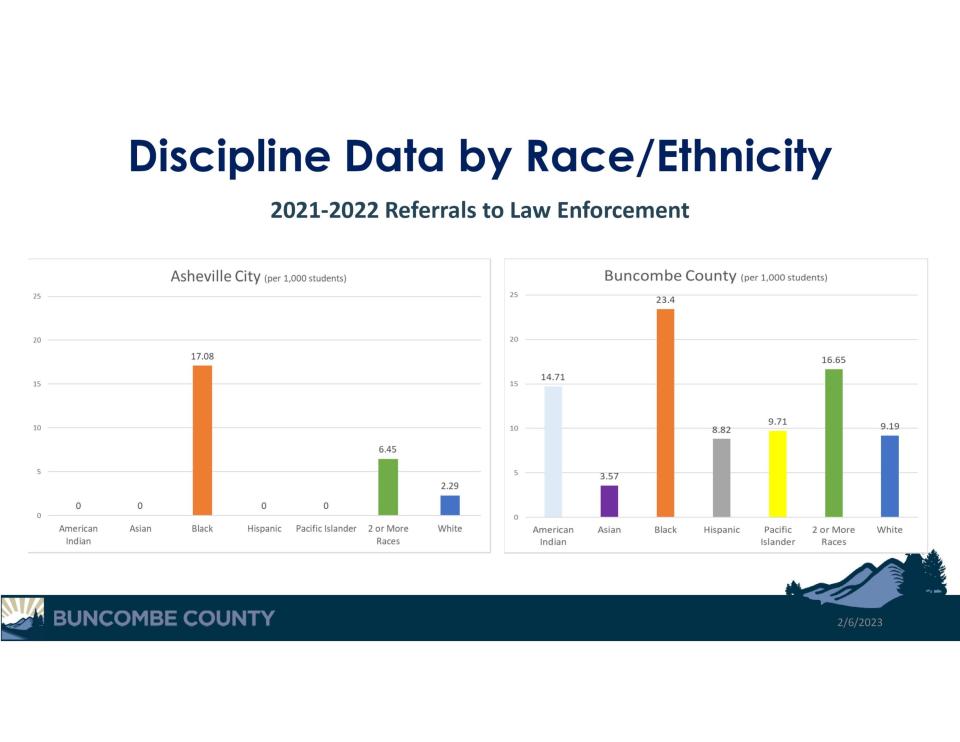
In addition to the gaps in educational achievement, Black students are significantly more likely than white peers to be out of school and to be disciplined, the report said, either through short term suspension or referrals to law enforcement.
Per 1,000 students, Asheville City Schools referred 17.1 Black students to law enforcement during the 2021-22 school year, in comparison to the 2.29 white students it referred over the same time period.
Buncombe County Schools saw even higher numbers of referrals, but a smaller racial gap, in the 2021-22 school year. Per 1,000 students, the district referred 23.4 Black students to law enforcement compared to 9.2 white students.
To address these gaps, Causby and Jackson said their districts are taking a look or have taken a look at codes of conduct to see where punishments can be changed or where unwanted behaviors can be dealt with in alternative ways.
One way, Causby mentioned, is a "reset room," where students can go and work out their feelings on punching bags and exercise equipment. Both districts are also investing in training for staff on bias and alternate ways of dealing with unwanted behavior.
Causby and presenter Rachael Nygaard, the county's director of strategic partnerships, stressed that it is the job of a whole community, not a single organization, to improve education. The county has been working with two nonprofits, the local United for Youth Network and the statewide MyFutureNC, to help close the gaps.
"While we contribute more than a quarter of the county budget towards education each year ... the amount of direct services that we deliver is smaller that in some of our focus areas on the Strategic Plan," Nygaard said. "It takes collective action across all sectors and collective ownership across all sectors."
Many metrics continue to be down from pre-pandemic highs, too, as the pandemic has continued to impact student achievement and behavior, the report and the two superintendents said.
The county's role, the report said, should be to prioritize education in the county's plans; create or support things like affordable housing, economic development and libraries; continue to fund education; promote equity, diversity and inclusion in systems, policies and practices and provide collaborative leadership in the effort to reduce achievement gaps.
By the Numbers
Student Demographics (2021-22)
Asheville City Schools:
61% white
20% Black
9% Hispanic
7% mixed
2% Asian
1% other
Buncombe County Schools:
65% white
21% Hispanic
7% Black
5% mixed
1% Asian
1% other
Percent of Students Economically Disadvantaged (2021-22):
Asheville City Schools: 32%
Buncombe County Schools: 48%
Charter schools: 31%
Kindergartners Considered Ready Across Both Districts (2022-23)
71% of white students
52% of Black students
51% of Hispanic students
59% of all other students
Percent of Students Grades Three to Eight Considered Math Proficient (2021-22)
Asheville City Schools:
81% of Asian students
66% of white students
36% of Hispanic students
30% of mixed students
11% of Black students
Buncombe County Schools:
77% of Asian students
64% of Native American students
61% of white students
42% of mixed students
39% of Hispanic students
21% of Black students

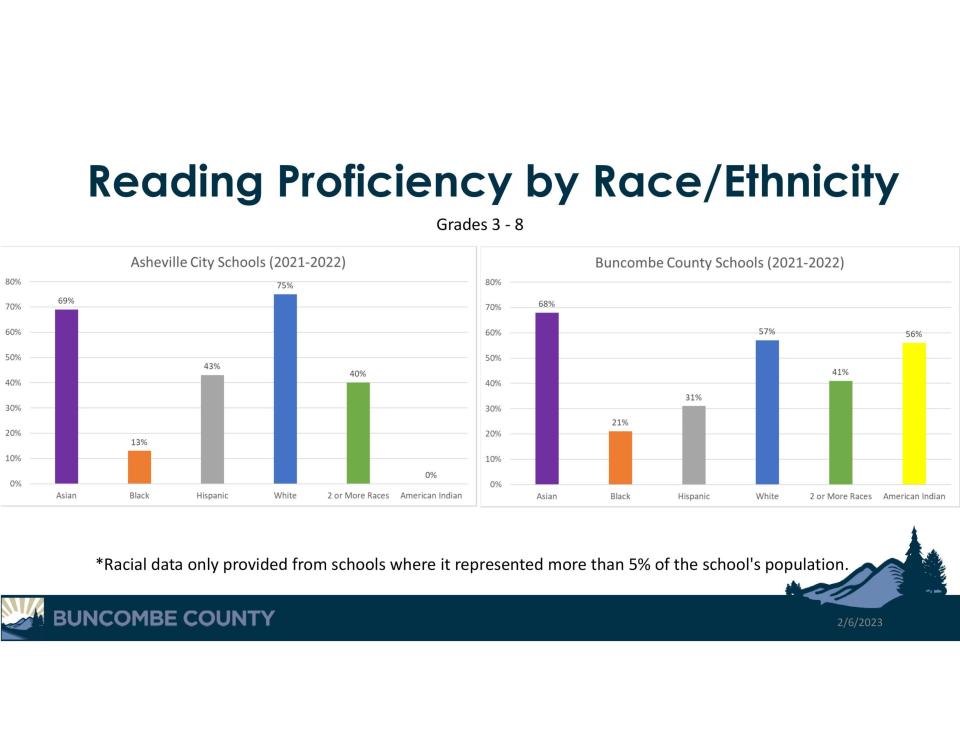
Percent of Students Grades Three to Eight Considered Reading Proficient (2021-22)
Asheville City Schools:
75% of white students
69% of Asian students
43% of Hispanic students
40% of mixed students
13% of Black students
Buncombe County Schools:
68% of Asian students
57% of white students
56% of Native American students
41% of mixed students
31% of Hispanic students
21% of Black students
Percent of Students Grade 11 Considered College Ready (2021-22)
Asheville City Schools:
76% of white students
33% of Hispanic students
32% of mixed students
12% of Black students
Buncombe County Schools:
78% of Asian students
55% of white students
33% of mixed students
30% of Hispanic students
25% of Black students
Graduation Rates (2021-22)
Asheville City Schools:
95% of Hispanic students
94.9% of white students
86.4% of Black students
75% of mixed students
Buncombe County Schools:
94.4% of Asian students
89.7% of white students
88.3% of Hispanic students
87% of Black students
82.2% of mixed students
Christian Smith is the general assignment reporter for the Asheville Citizen Times. Questions or comments? Contact him at RCSmith@gannett.com or 828-274-2222.
This article originally appeared on Asheville Citizen Times: Buncombe County Schools, Asheville City Schools have achievement gaps

