Bitcoin Dominance (BTCD) Continues to Slip, Altcoins Flourish
The bitcoin dominance rate (BTCD) has broken down from a long-term support level at 57.5%.
In the long-term, the BTCD is expected to continue moving downwards until it reaches the 50% support level.
Long-term BTCD trend
The BTCD has been moving downwards since it reached a high of 71.30% in December 2020.
At the end of March 2021, it reached the 57.75% level, which had previously been acting as support since April 2019. It has since fallen below and is searching for support.
The next support level will likely be found at 49.8%. This is the 0.618 Fib retracement level of the entire upward movement, measuring from 2018.
Technical indicators are bearish. The MACD is negative, the Stochastic oscillator has just made a bearish cross, and the RSI is very close to decreasing below 30.
Therefore, in the long-term, it’s likely that the BTCD falls all the way to 49.80%.
Furthermore, if the ongoing decrease from October 2019 is a flat A-B-C structure, the 1:1.61 ratio between waves A:C would fall at 48%. This projects even more strength on the 50% level.

Cryptocurrency trader @Damskotrades outlined a BTCD chart, stating that it could potentially continue falling all the way back down to the range lows at 36.5%.
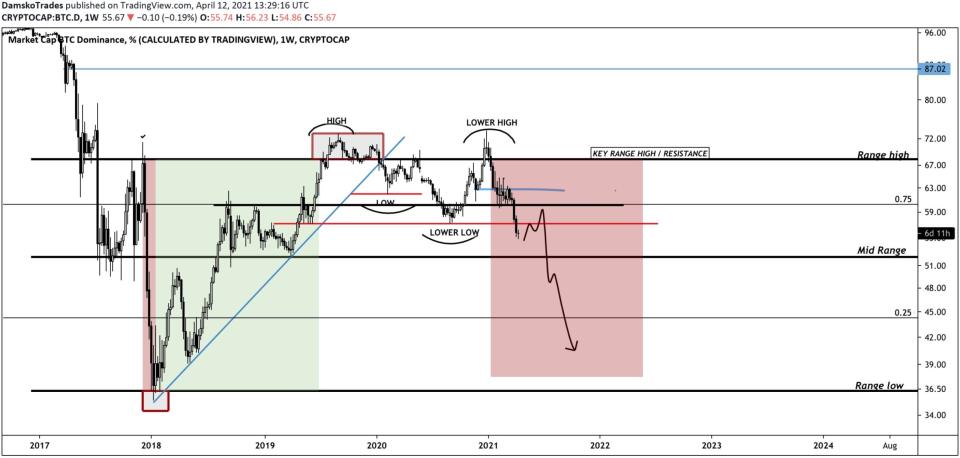
This is certainly possible, especially considering long-term indicators look bearish. However, it has to first break down from the 50% area for this to occur.
Short-term BTCD movement
The daily chart shows that the BTCD has been decreasing since breaking down from a fourth wave triangle on March 28.
There are two potential targets for the bottom of this movement, found at 54.73% and 49.4%. The first is found by projecting the 1:0.618 length of waves 1-3, while the second target is the 1:1 length. Since the latter also fits with the longer-term outlook, it’s more likely to be reached.
Similar to the weekly time-frame, technical indicators are bearish despite a potential bullish divergence in the RSI.

ETH/BTC
Since Ethereum (ETH) is the largest altcoin, it makes sense to take a look at the ETH/BTC pair.
After reclaiming the ₿0.0352 resistance area, ETH returned to validate it as support on April 12. It has been moving upwards since.
There is resistance at ₿0.0397, which is also the 0.618 Fib resistance level. However, the main resistance area is found at ₿0.046, made by the February highs.

Conclusion
It’s likely that the BTCD will continue its long-term bearish trend towards 50%.
ETH/BTC is expected to increase towards ₿0.046.
For BeInCrypto’s latest bitcoin (BTC) analysis, click here.

