Bitcoin (BTC) Searches for Support After Failure to Break Out
Bitcoin (BTC) resumed its descent yesterday following a rejection from resistance on June 15.
It has reached a short-term horizontal and diagonal support level that could push the price higher.
Bitcoin fails to break out
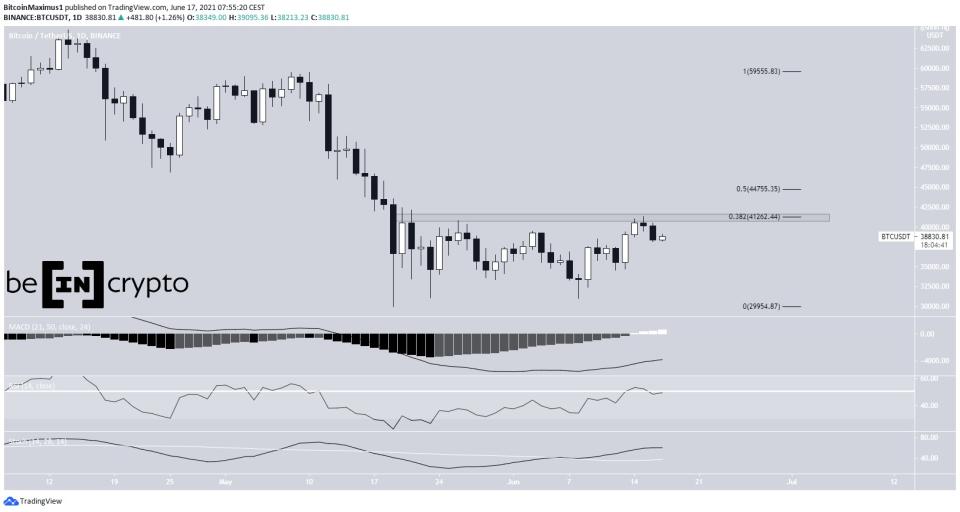
On June 15, BTC reached a high of $41,330. The high was made inside the 0.382 Fib retracement resistance level at $41,250. Bitcoin has been moving downwards since. On June 16, it created a bearish candlestick and fell to a low of $38,116 in the process.
Regardless of the drop, technical indicators are providing a bullish outlook. The MACD’s momentum bar has created three bars in the positive territory. Both the RSI and Stochastic oscillator are increasing; the former is above 50 while the latter has made a bullish cross.
These signs point to an eventual breakout above the aforementioned resistance area. If this occurs, the next resistance would likely be found at the 0.5 Fib retracement level at $44,755.

Potential bounce
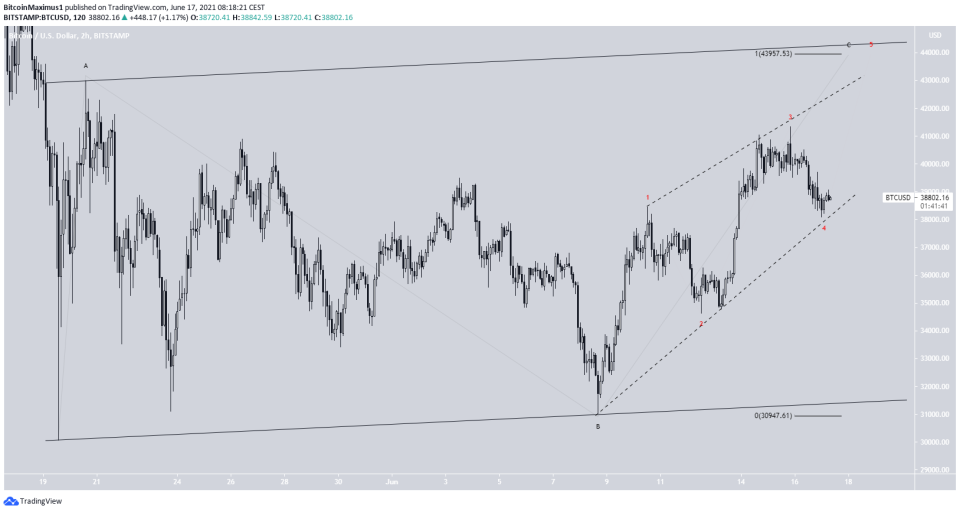
The two-hour chart shows an ascending support line that has been in place since July 8. Yesterday’s drop caused the third validation of this line (green icon).
In addition, the low coincided with the $38,000 horizontal support area, making it a very suitable level for a bounce.
However, the MACD and RSI have yet to confirm the bullish reversal, though the former is showing signs of doing so.

BTC wave count
The movement since the May 19 low can be contained inside an ascending parallel channel. Therefore, it’s likely that this is an A-B-C corrective structure.
A high near $43,950 would give waves A:C a 1:1 ratio and cause BTC to move all the way to the resistance line of the channel.
The sub-wave count (red) shows that the most recent portion of the movement could form an ending diagonal, after which a downward movement would be likely.
For the longer-term count, click here.

For BeInCrypto’s previous bitcoin (BTC) analysis, click here.

