Bitcoin (BTC) Reaches Highest-Ever Weekly Close
The Bitcoin (BTC) price increased slightly last week and reached its highest-ever weekly close.
BTC is expected to break out above the current horizontal resistance area and reach a new all-time high price.
Highest-ever weekly close
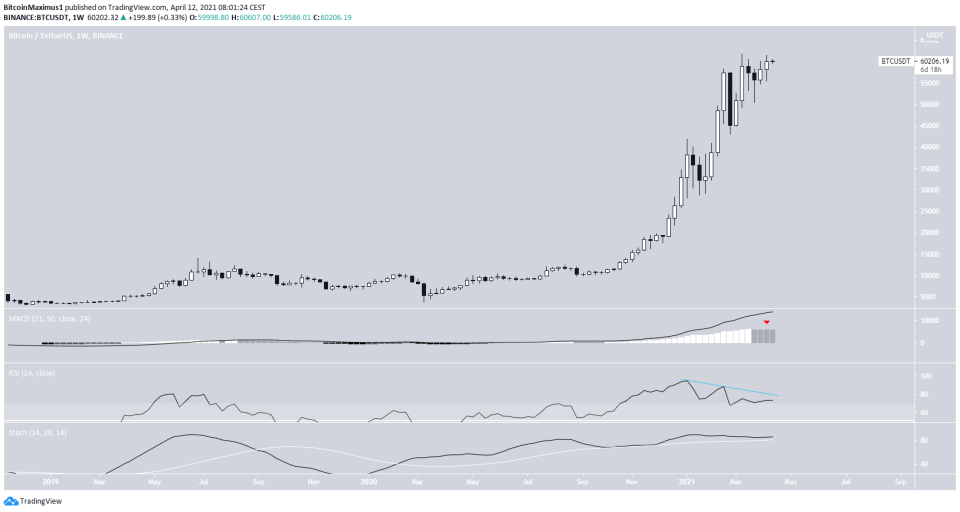
BTC increased slightly last week, going from a low of $55,473 to a high of $61,500. It managed to close at $60,002, which was simultaneously the first close above $60,000 and the highest-ever weekly close.
There are some signs of weakness, however. There is a decreasing momentum in the MACD and a bearish divergence developing in the RSI. However, the RSI has yet to reach its divergence line and the MACD has not yet made a bearish reversal signal.
Therefore, the signs are not sufficient enough to predict that a top has been reached.
BTC aims for new all-time high
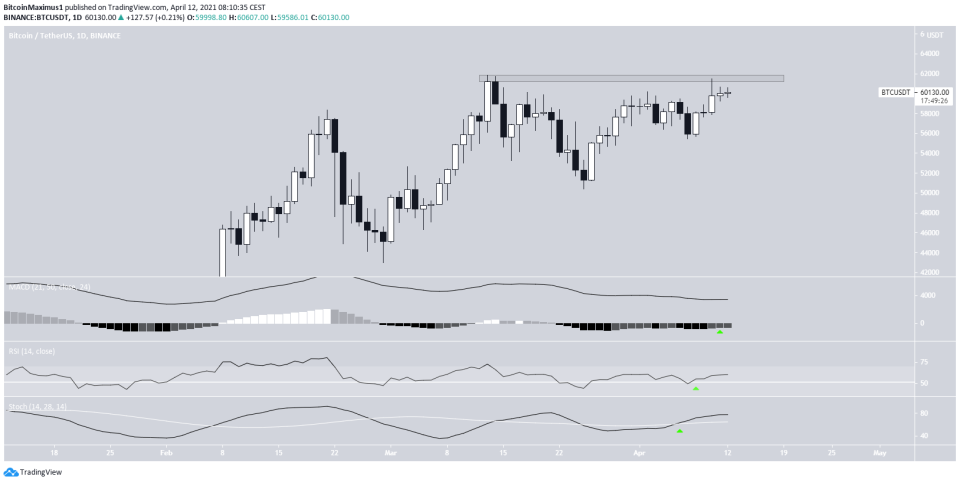
The daily chart looks decisively bullish.
While BTC was rejected on its attempt at a new all-time high on April 10, it is currently gearing up for another upward movement.
Technical indicators are bullish.
The RSI has moved above 50, the MACD has given a bullish reversal signal, and the Stochastic oscillator is moving upwards.
Therefore, the price is expected is reach a new all-time high.
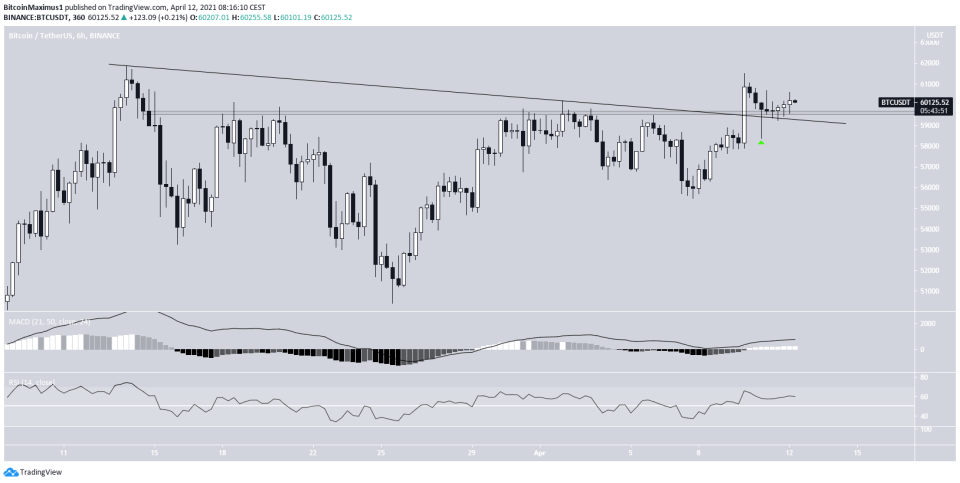
The six-hour chart also supports this.
BTC has broken out from a descending resistance line and validated it as support after. This candlestick also created a very long lower wick.
In addition, it has reclaimed the $59,600 resistance area. Technical indicators are bullish. Therefore, a breakout is expected, followed by a new all-time high.
For the long-term wave count click here.
Conclusion
Both the daily and short-term bitcoin charts support the possibility of a breakout and a new all-time high price.
For BeInCrypto’s previous bitcoin (BTC) analysis, click here.

