Bitcoin (BTC) Flash Crashes After Dropping Below $60,000
Bitcoin (BTC) reached a new all-time high price on April 14 but decreased considerably shortly afterwards.
Despite the drop, the bullish structure for BTC is still intact. Nevertheless, the short-term recovery has been V-shaped, thus a retracement is expected before eventual continuation.
Long-term BTC movement
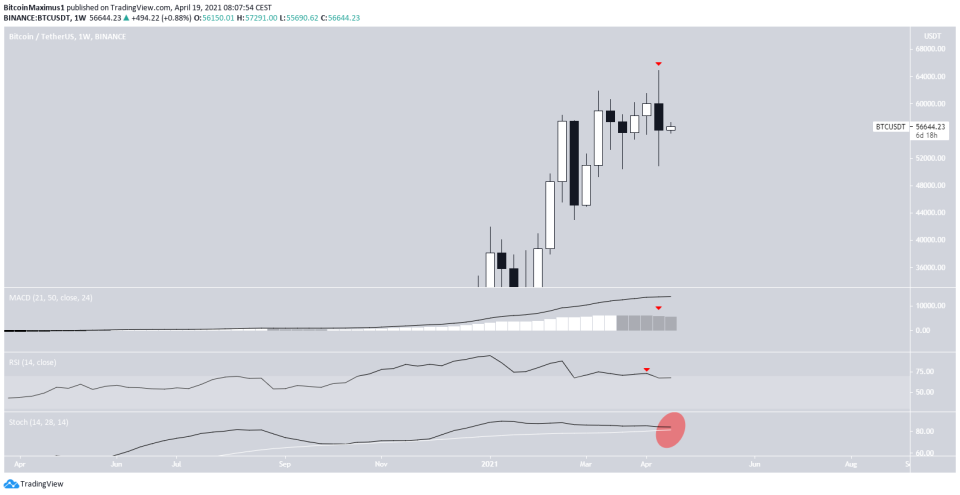
The BTC movement throughout the week of April 12 to April 18 was eventful. It reached an all-time high price of $64,854 on April 14.
However, it began to decrease shortly afterward, with the rate of decrease accelerating on April 18. BTC reached a low of $50,931 the same day.
Currently, BTC has bounced back and is trading near $57,000.
Despite the ongoing recovery, technical indicators are bearish. The MACD has given a bearish reversal signal and the RSI has dropped below 70. The Stochastic oscillator is decreasing but has not yet made a bearish cross.
When combined with the bearish candlestick, the long-term trend is showing significant weakness.
Daily BTC chart
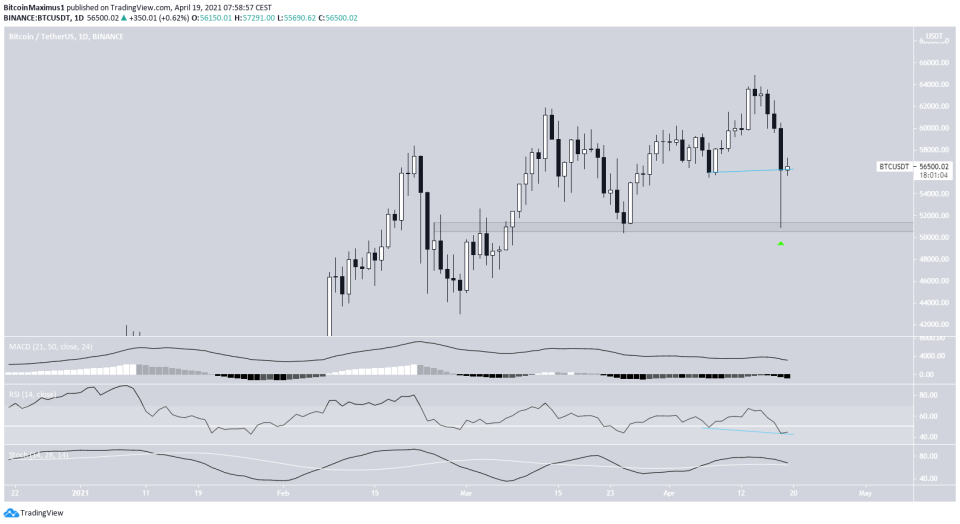
The daily chart is not as bearish. BTC has created a long lower wick with a magnitude of 9%. This is a very strong sign of buying pressure. In addition, it was created right at the $51,000 support area.
Furthermore, technical indicators are still bullish. The RSI has generated a considerable hidden bullish divergence, which was confirmed with yesterday’s close.
The MACD is positive and the Stochastic oscillator has yet to make a bearish cross.
Short-Term Movement
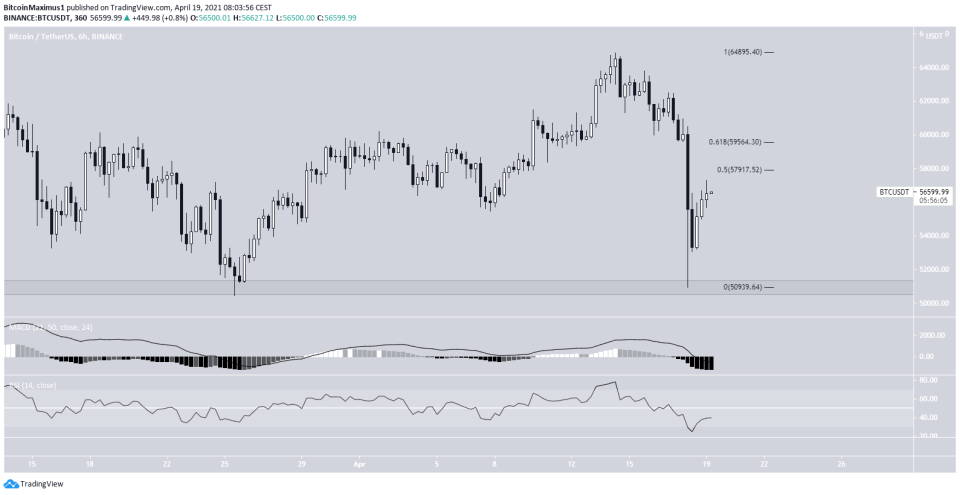
The six-hour chart shows the main resistance areas, which are found at $57,900 and $59,500. They are created by the 0.5 and 0.618 Fib retracement levels respectively.
The current recovery has been V-shaped, which is unusual.
Technical indicators are still bearish. Therefore, it seems unlikely that BTC will be able to clear both these resistance areas without some type of rejection transpiring.
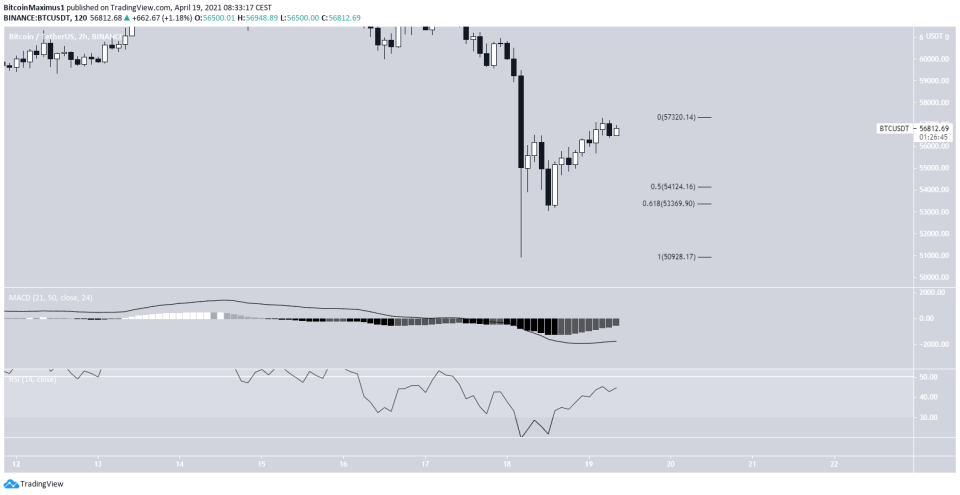
The two-hour chart provides some bullish signs, but does not confirm the reversal.
If BTC decreases, the main support levels would be found at $53,370 and $54,100.
Conclusion
The long-term chart is showing weakness but does not yet confirm a reversal. Furthermore, the bullish structure is still intact.
Whether BTC makes a higher-low or drops below the wick lows from yesterday will go a long way in determining the direction of the future movement.
For BeInCrypto’s previous bitcoin (BTC) analysis, click here.
