AGCO's (NYSE:AGCO) five-year earnings growth trails the 13% YoY shareholder returns
If you buy and hold a stock for many years, you'd hope to be making a profit. But more than that, you probably want to see it rise more than the market average. But AGCO Corporation (NYSE:AGCO) has fallen short of that second goal, with a share price rise of 66% over five years, which is below the market return. The last year has been disappointing, with the stock price down 16% in that time.
Since the stock has added US$480m to its market cap in the past week alone, let's see if underlying performance has been driving long-term returns.
Check out our latest analysis for AGCO
To paraphrase Benjamin Graham: Over the short term the market is a voting machine, but over the long term it's a weighing machine. One imperfect but simple way to consider how the market perception of a company has shifted is to compare the change in the earnings per share (EPS) with the share price movement.
During five years of share price growth, AGCO achieved compound earnings per share (EPS) growth of 36% per year. The EPS growth is more impressive than the yearly share price gain of 11% over the same period. So it seems the market isn't so enthusiastic about the stock these days. The reasonably low P/E ratio of 10.64 also suggests market apprehension.
The company's earnings per share (over time) is depicted in the image below (click to see the exact numbers).
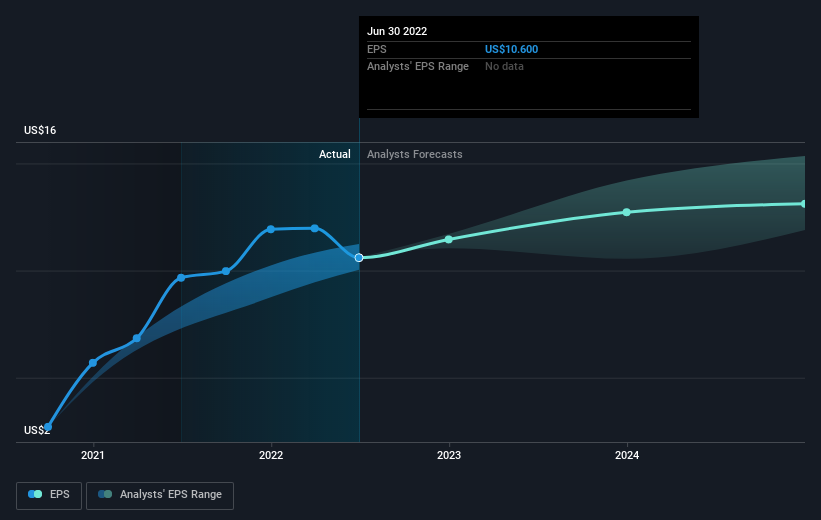
Dive deeper into AGCO's key metrics by checking this interactive graph of AGCO's earnings, revenue and cash flow.
What About Dividends?
As well as measuring the share price return, investors should also consider the total shareholder return (TSR). The TSR incorporates the value of any spin-offs or discounted capital raisings, along with any dividends, based on the assumption that the dividends are reinvested. It's fair to say that the TSR gives a more complete picture for stocks that pay a dividend. We note that for AGCO the TSR over the last 5 years was 85%, which is better than the share price return mentioned above. The dividends paid by the company have thusly boosted the total shareholder return.
A Different Perspective
While the broader market lost about 7.5% in the twelve months, AGCO shareholders did even worse, losing 12% (even including dividends). However, it could simply be that the share price has been impacted by broader market jitters. It might be worth keeping an eye on the fundamentals, in case there's a good opportunity. Longer term investors wouldn't be so upset, since they would have made 13%, each year, over five years. It could be that the recent sell-off is an opportunity, so it may be worth checking the fundamental data for signs of a long term growth trend. It's always interesting to track share price performance over the longer term. But to understand AGCO better, we need to consider many other factors. Even so, be aware that AGCO is showing 3 warning signs in our investment analysis , and 1 of those doesn't sit too well with us...
Of course, you might find a fantastic investment by looking elsewhere. So take a peek at this free list of companies we expect will grow earnings.
Please note, the market returns quoted in this article reflect the market weighted average returns of stocks that currently trade on US exchanges.
Have feedback on this article? Concerned about the content? Get in touch with us directly. Alternatively, email editorial-team (at) simplywallst.com.
This article by Simply Wall St is general in nature. We provide commentary based on historical data and analyst forecasts only using an unbiased methodology and our articles are not intended to be financial advice. It does not constitute a recommendation to buy or sell any stock, and does not take account of your objectives, or your financial situation. We aim to bring you long-term focused analysis driven by fundamental data. Note that our analysis may not factor in the latest price-sensitive company announcements or qualitative material. Simply Wall St has no position in any stocks mentioned.
Join A Paid User Research Session
You’ll receive a US$30 Amazon Gift card for 1 hour of your time while helping us build better investing tools for the individual investors like yourself. Sign up here

