2 Treasury Indicators That Could Show the Risk of Recession
The yield spread is at one of its lowest levels ever and still falling. An inverted yield curve is a well-known predictor of economic recessions. It has also indicated bearish stock returns in the future. This week I’m going to examine the spread between the 10-year treasury note and the 3-month treasury bond. This spread has been a better signal of recessions and bearish stock returns than the more popular spread between the ten-year and two-year rates.
The chart below shows the S&P 500 Index (SPX) since the late 1990’s along with the yield spread. The spread first inverted about six weeks ago. That means the yield on the short-dated bond became higher than the yield on the long-dated bond. Since then, the yield has only gotten more negative. The only time we’ve seen more extreme readings was in late 2000 when the tech bubble burst leading to two more years of stock market declines.

Yield Curve Inversion
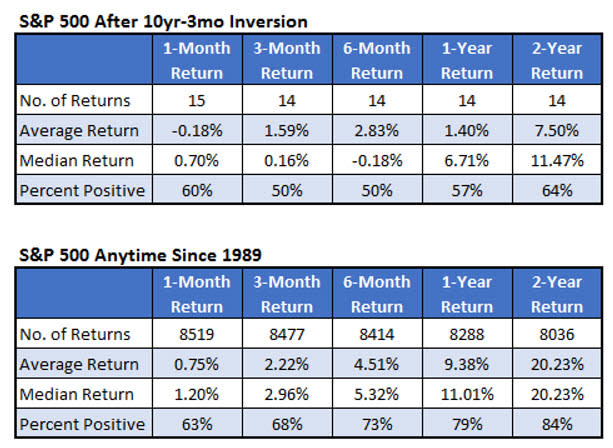
The table below summarizes the S&P 500 performance immediately following an inversion of the 10-year – 3-month yield curve. The recent inversion was the 15th time we’ve seen this since 1989, the first year we have daily data for the relevant rates in our database. The underperformance is stark. One year after an inversion, the S&P 500 averaged a gain of just 1.4% with 57% of the return positive. Typically, the index gains over 9% on average with nearly 80% of the returns positive.
I mentioned that the latest signal occurred about six weeks ago. The stock market has been very strong after that signal. The S&P 500 gained 6% in the month after that signal. I wondered if a strong return in the first month mitigated the bearish signal going forward. The good news is that looks to have been the case. When the S&P 500 has gained at least 2% in the first month after a signal, it averages a gain of 9.68% in the six months after a signal compared to about a 1% loss after the other signals.
After these strong starts, the S&P 500 averaged a return of about 26% over the next two years with four of five returns positive. When stocks don’t start that strong after an inversion, the index averages a loss of 2.75% over the two years with 56% of the returns positive. The one-year return look odd in that first table with an average return of just 2.5% between big average returns at six months and two years. That’s because one signal in early 2019 showed a strong six-month return but then the coronavirus pandemic hit before the one-year timeframe in which the market lost 20%.

Inversion Persistence
I mentioned that the spread became inverted about six weeks ago. Specifically, the ten-year – three-month spread has been inverted for 28 straight trading days. This is the sixth time the spread has been inverted for this amount of time. The table below summarizes the S&P 500 returns after the 28th-straight day of an inverted yield spread. The summarized returns in the table below look like typical S&P 500 returns since 1989. It’s only five returns so I can’t be confident in its predictability going forward but this along with the strong returns since the inversion six weeks ago hopefully diminishes the indicators bearish implications.

