I wrote THE BEST presidential briefing on global warming for Donald Trump

Given that no one seems to know what President Trump thinks about the reality of human-caused climate change, perhaps we can agree that it's about time that he received a briefing on the subject.
Normally this would fall to his science advisor, or someone from the White House Office of Science and Technology Policy, or perhaps the head of the National Oceanic and Atmospheric Administration, or even the NASA administrator.
However, he hasn't appointed anyone to those positions... So, it's up to me to get this on his desk.
SEE ALSO: Trump flips the middle finger to the world, your future
In putting this together, I had to constantly remind myself that the briefing can't be just any old document. Recent news reports have revealed that Trump consumes his intelligence information the way an eighth-grader researches assignments on Wikipedia.
He's a fan of short bullet points and an abundance of maps and charts, rather than dense text and pesky nuance or ambiguity. He also apparently likes it when the daily brief, or "PDB," as intel pros call it, refers to himself.
As Director of National Intelligence and presidential briefer Dan Coats put it to the Washington Post recently, "Sometimes... pictures do say a thousand words."
So, here's the President's Daily Brief on climate change, presented in the way that Trump prefers it: bullets and charts, and a few references to DJT himself:
CLIMATE CHANGE PDB/June 5, 2017
*****TOP SECRET/PLEASE DON'T TELL RUSSIA/SERIOUSLY THIS TIME****
1. Global warming is real.
It has not stopped or significantly slowed. It's not an artifact of bad data, either, and it's not part of a continually changing, natural climate cycle. Anyone who says, "the climate is always changing," without making clear that current developments are new, concerning, and very real, is not being honest.
Also, anyone who tells you there are more jobs to be generated in the coal industry than solar power is straight up lying.
Now here's the BEST chart!
This one shows how temperatures have trended since 1880, which is when instrument records began.
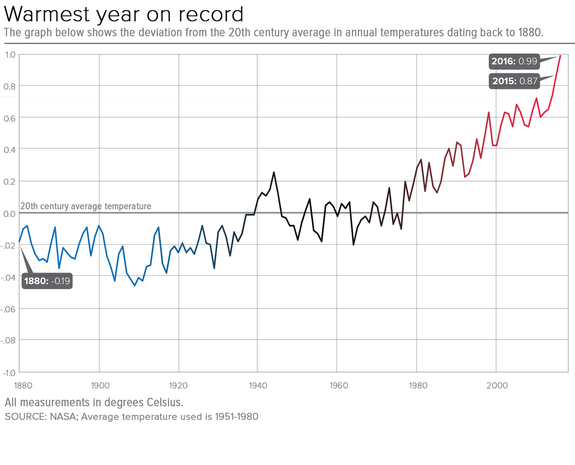
Image: bob al-greene/mashable/nasa
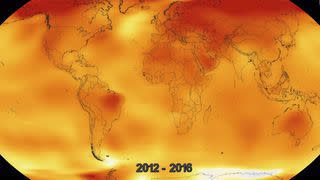
Perhaps a video is more your thing... here's the BEST global warming video.
This shows 136 years of global warming in just 30 seconds.
2. It's our fault.
Global warming is mainly caused by the burning fossil fuels like coal and oil for energy. Land use change like cutting down forests also plays a role.
There are natural causes of climate change, but they're not the main reason why the Earth is warming right now.
Stop shaking your head, I'm serious about this. It just ain't natural. I wish it were. Most scientists wish it were.
The level of carbon dioxide — which the Supreme Court and the Environmental Protection Agency have labeled as a "pollutant" — in the Earth's atmosphere is the highest it has been in all of human history.
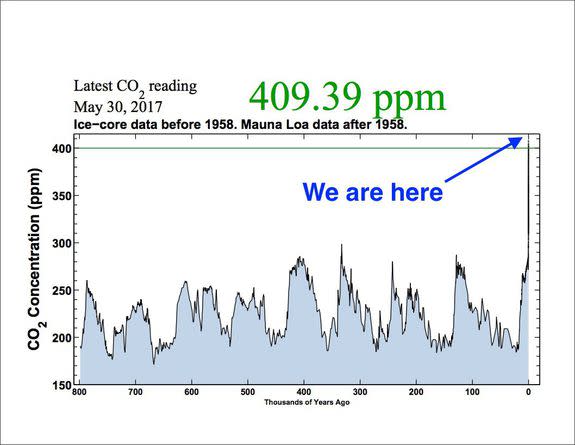
Image: scripps institution of oceanography/mashable
Here's a chart showing how current levels of carbon dioxide compares to the amount throughout all of human history and even further back in time, to 800,000 years ago. The ups and downs in past periods represent natural occurrences, whereas the current spike is due to human activity, according to scientists.
As the National Climate Assessment (and many, many others) found, "natural drivers of climate cannot explain the recent observed warming. Over the last five decades, natural factors (solar forcing and volcanoes) alone would actually have led to a slight cooling."
That was a lot of text, DJT, so here's a FABULOUS way of saying the same thing:
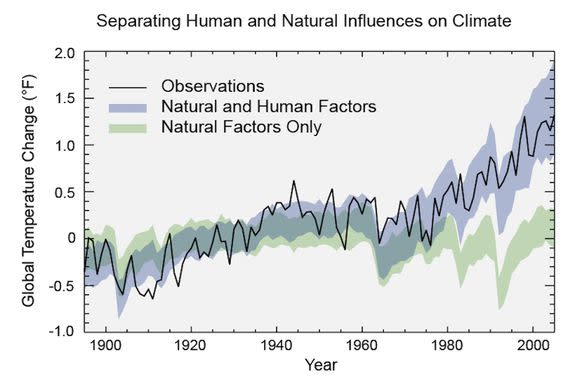
Image: national climate assessment
Isn't this a pretty chart? It has blue and black and red on it. It's about the oceans.
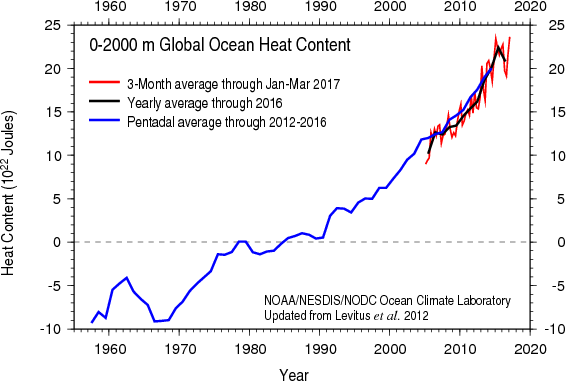
Image: noaa
It's not just the air that's heating up either. The fingerprints of climate change can be found throughout the climate system, including in the oceans, which are absorbing the vast majority of extra heat.
Here's the PERFECT graphic for you. It's known as the "climate spiral" and it shows the increase in global temperatures from 1850 to 2016. Isn't this the most beautiful piece of cake... I mean, the most beautiful climate graphic ever?

Image: ed hawkins
3. Scientists agree on this.
Several studies have focused on how many climate scientists agree or disagree that global warming is mainly human-caused.
It turns out that at least 97 percent of climate studies examined agreed that human activities are the main cause of global warming since the industrial revolution. This is what people mean when they refer to the "scientific consensus" on global warming.
Head's up, POTUS: The people who work for you tend to fall among the 3 percent who don't recognize this consensus, including Scott Pruitt at the EPA, Rick Perry at the Energy Department, Sonny Perdue at Agriculture, and numerous White House advisors.
But hey, maybe that's a coincidence?
4. It is already having damaging impacts.
Climate change is already causing longer-lasting, more intense heat waves, an increase in the proportion of heavy downpours compared to gentler rainstorms, and sea level rise that's inundating coastal areas worldwide.
Sea ice is thinning and melting, clearing the way for a seasonally ice-free Arctic Ocean. Land ice is also melting at increasing rates in Greenland and Antarctica, which is, in turn, raising sea levels. The ocean is turning more acidic. Species and diseases are on the move.
These problems and more aren't going away.
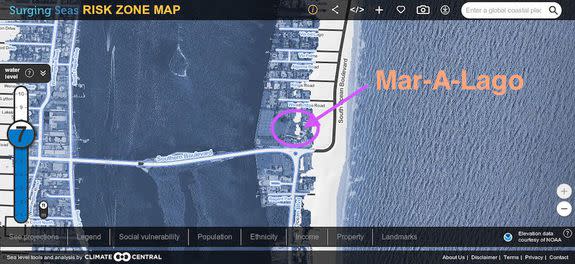
Image: climate central
Your properties are not immune to sea level rise, either. For example, here is what Mar-a-Lago may look like with 7 feet of sea level rise — which is at the upper end of projections for this century.
Even the military is concerned about global warming, since it could bring greater instability to already stressed regions, such as the Middle East. It also may imperil U.S. facilities, with more frequent flood events at Navy and coastal Air Force bases, for example.
Here's THE MOST AWESOME animation of sea ice trends.

Image: zack labe
5. It will only get worse, unless you act.
It's up to us to decide how much the planet will warm, and therefore how high the seas will get, in coming years.
The Paris Agreement, which you just tossed aside, would help limit global warming but wouldn't entirely solve the problem. It might cause the country to incur some costs at the outset, as we switch to more renewable energy sources, but it would ultimately save money since global warming has its own costs.
A 2014 study by a bipartisan group of business executives and former political leaders found that extreme heat and sea level rise will threaten human health and put up to $3.5 billion of U.S. property in jeopardy by 2030, with even more severe and expensive impacts to come after that.
Here's the MOST BEAUTIFUL climate chart you've ever seen, showing where the climate was headed before Paris, where it's going with the current Paris goals, and where it needs to go to meet the agreement's temperature target.
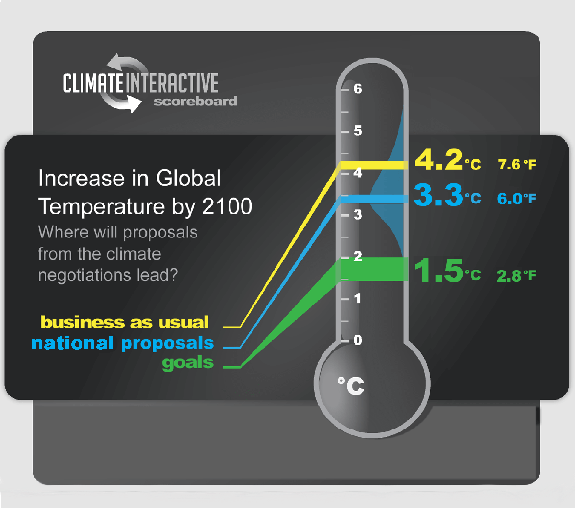
Image: climate interactive
6. Weather is not climate.
Climate and weather are different. Weather is comprised of day-to-day atmospheric events. Climate is the average of those events.
Weather is variable, chaotic-even, and difficult to forecast. Climate trends are controlled by larger forces, like greenhouse gases or changes in Earth's orbit.
Therefore, it's actually easier to project climate change on longer timescales compared to long-term weather forecasts.
*****TOP SECRET/PLEASE DON'T TELL RUSSIA/SERIOUSLY THIS TIME*****
WATCH: It's official, 2016 was Earth's warmest year on record