Vodafone Group Plc’s (LSE:VOD) EPS Grew 69.3% In A Year. Was It Better Than Long-Term Trend?

After reading Vodafone Group Plc’s (LSE:VOD) most recent earnings announcement (30 September 2017), I found it useful to look back at how the company has performed in the past and compare this against the latest numbers. As a long term investor, I pay close attention to earnings trend, rather than the figures published at one point in time. I also compare against an industry benchmark to check whether Vodafone Group’s performance has been impacted by industry movements. In this article I briefly touch on my key findings. See our latest analysis for VOD
How Well Did VOD Perform?
I look at the ‘latest twelve-month’ data, which either annualizes the most recent 6-month earnings update, or in some cases, the most recent annual report is already the latest available financial data. This blend enables me to examine different companies on a more comparable basis, using the most relevant data points. Vodafone Group’s latest twelve-month earnings -€866.0M, which compared to the prior year’s level, has become less negative. Since these figures are somewhat nearsighted, I’ve calculated an annualized five-year figure for VOD’s earnings, which stands at €3,490.0M.
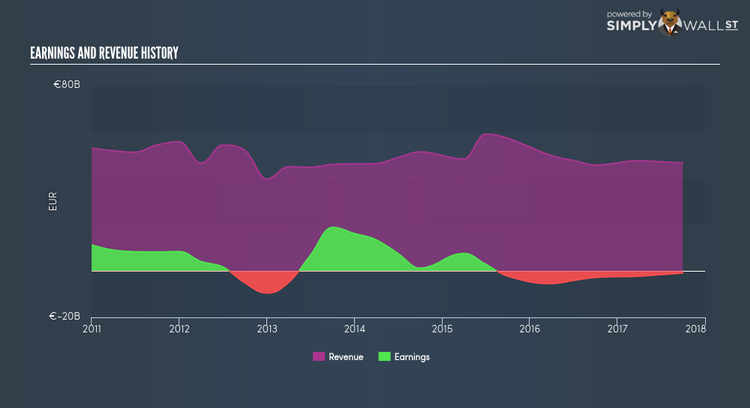
Additionally, we can evaluate Vodafone Group’s loss by looking at what has been happening in the industry along with within the company. Initially, I want to quickly look into the line items. Revenue growth over last few years has been relatively soft, remaining flat on average at -0.92%. Given that top-line growth is also pretty flat, the key to profitability in the future would be managing costs. Looking at growth from a sector-level, the UK wireless telecommunication services industry has been enduring some headwinds in the prior year, leading to average earnings dropping by more than half. This is a a notable change, given that the industry has been delivering a relatively flat growth rate over the last few years. This shows that any recent headwind the industry is facing, Vodafone Group is less exposed compared to its peers.
What does this mean?
Though Vodafone Group’s past data is helpful, it is only one aspect of my investment thesis. Companies that incur net loss is always hard to envisage what will happen in the future and when. The most valuable step is to examine company-specific issues Vodafone Group may be facing and whether management guidance has steadily been met in the past. You should continue to research Vodafone Group to get a better picture of the stock by looking at:
1. Future Outlook: What are well-informed industry analysts predicting for VOD’s future growth? Take a look at our free research report of analyst consensus for VOD’s outlook.
2. Financial Health: Is VOD’s operations financially sustainable? Balance sheets can be hard to analyze, which is why we’ve done it for you. Check out our financial health checks here.
3. Other High-Performing Stocks: Are there other stocks that provide better prospects with proven track records? Explore our free list of these great stocks here.
NB: Figures in this article are calculated using data from the last twelve months, which refer to the 12-month period ending on the last date of the month the financial statement is dated. This may not be consistent with full year annual report figures.
To help readers see pass the short term volatility of the financial market, we aim to bring you a long-term focused research analysis purely driven by fundamental data. Note that our analysis does not factor in the latest price sensitive company announcements.
The author is an independent contributor and at the time of publication had no position in the stocks mentioned.
